
Following the escalation of the US-Iran conflict, the US dollar strengthened to a five-week high of 98.75 on the USDX after reports of the effective blockade of the Strait of Hormuz, through which up to 20.0% of global oil traffic passes. The disruption is expected to drive hydrocarbon prices higher due to reduced global supply. Production in the Persian Gulf region amounts to around 10.0 million barrels per day, and a deficit of 5.0–10.0% could lift Brent Crude Oil prices by 18.0–25.0%, from $80.0 per barrel to $95.0–100.0 per barrel. Spot natural gas prices in the EU could rise from €30.0 per MWh to €40.0–45.0 per MWh, or by 33.0–50.0%. The situation is boosting demand for the dollar as a safe-haven asset, while alternative currencies, including the euro, are weakening. Continued hostilities in the Middle East will also affect the Federal Reserve’s monetary policy outlook. Most analysts believe the regulator will shift toward maintaining current interest rates to combat inflation, as January CPI exceeded the 2.0% target, coming in at 2.4% headline and 2.5% core, while core producer prices accelerated from 3.3% to 3.6%. Some analysts mention the possibility of a return to dovish rhetoric and expanded money supply to support the Republican administration’s foreign policy financing, but given the open confrontation between President Donald Trump and the Fed leadership, this scenario appears unlikely.
The US currency is also supported by recently published data: in February, the manufacturing PMI rose to 51.6 points, above forecasts of 51.2 and unchanged from the previous reading, while the ISM manufacturing employment index came in at 48.8 points versus expectations of 48.3. The ISM prices component surged to 70.5 points, significantly exceeding the projected 60.6 and the prior 59.0.
Meanwhile, Eurozone inflation data for February showed acceleration: the consumer price index increased from –0.6% to 0.7% month-on-month and from 1.7% to 1.9% year-on-year, while the core reading rose from –1.1% to 0.8% monthly and from 2.2% to 2.4% annually. These figures are likely to influence the European Central Bank’s rhetoric regarding monetary policy adjustments at its upcoming March 19 meeting.
Support and resistance levels
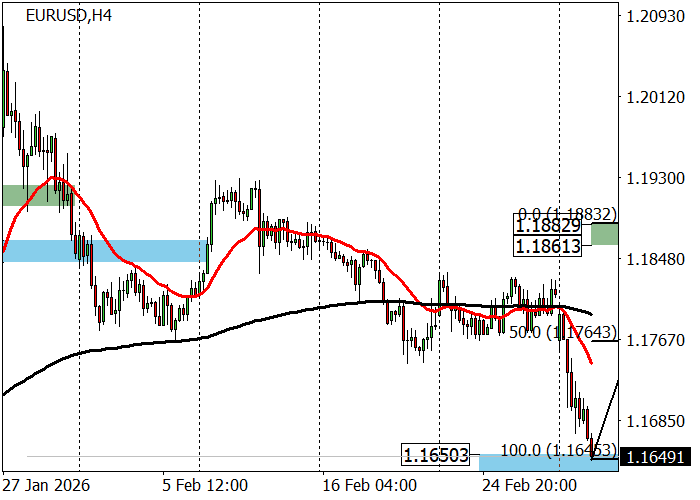
The long-term trend remains upward. This week, price is testing the key 1.1675 support level. A rebound from this area would open the way for long positions targeting 1.1790 and 1.1927 (February’s high). However, if the pair consolidates below this level, the trend may shift downward, making short positions toward the January low of 1.1583 relevant.
The medium-term downtrend has continued this week, with quotes reaching Zone 2 (1.1650–1.1628), where large players may lock in profits, potentially triggering a correction toward the key resistance area of 1.1882–1.1861. From that zone, short positions would target 1.1764 and 1.1645. If Zone 2 is decisively broken, further decline toward Zone 3 (1.1434–1.1412) is expected.
Resistance levels: 1.1790, 1.1927, 1.2045.
Support levels: 1.1675, 1.1583, 1.1480.
Trading scenarios and EUR/USD forecast
Long positions may be opened above 1.1705 with a target at 1.1790 and a stop-loss at 1.1665. Implementation period: 9–12 days.
Short positions may be opened below 1.1580 with a target at 1.1480 and a stop-loss at 1.1630.
Scenario
| Timeframe | Weekly |
| Recommendation | BUY STOP |
| Entry Point | 1.1710 |
| Take Profit | 1.1790 |
| Stop Loss | 1.1665 |
| Key Levels | 1.1480, 1.1583, 1.1675, 1.1790, 1.1927, 1.2045 |
Alternative scenario
| Recommendation | SELL STOP |
| Entry Point | 1.1575 |
| Take Profit | 1.1480 |
| Stop Loss | 1.1630 |
| Key Levels | 1.1480, 1.1583, 1.1675, 1.1790, 1.1927, 1.2045 |
