

Data from the University of Michigan released on Friday adjusted sentiment among US dollar bears: one-year inflation expectations were revised upward from 4.1% to 4.2%, while five-year expectations remained unchanged at 3.2%. It is also worth noting that data published on Thursday showed annual consumer price inflation in November slowing from 3.0% to 2.7%, below the forecast of 3.1%, while core CPI eased from 3.0% to 2.6%.
Meanwhile, geopolitical risks continue to support gold prices. The Russia–Ukraine conflict remains in an active phase, despite nearly a month of relatively intensive negotiations involving representatives from the United States, the European Union, Ukraine, and Russia. Investors are also closely monitoring developments surrounding Venezuela. Last week, US President Donald Trump announced that the Venezuelan government would be designated a “terrorist organization” and declared a full maritime blockade of oil tankers traveling to or from Venezuela. More recently, reports emerged that US naval vessels are pursuing another ship, Bella 1, marking the third such incident in recent days. Experts do not rule out the possibility of limited ground operations or airstrikes, although the White House is likely reluctant to escalate tensions further. Since September, the US has carried out strikes on more than 20 vessels in the Caribbean suspected of drug trafficking, resulting in at least 87 fatalities.
Volatility across the precious metals market remains subdued. According to data from the Chicago Mercantile Exchange (CME Group Inc.), investor futures positioning in gold totaled just 181.09 thousand contracts on Friday, while options positions stood at 84.84 thousand contracts, compared with average levels of 217.5 thousand and 72.00 thousand, respectively, recorded last week.
Support and resistance levels
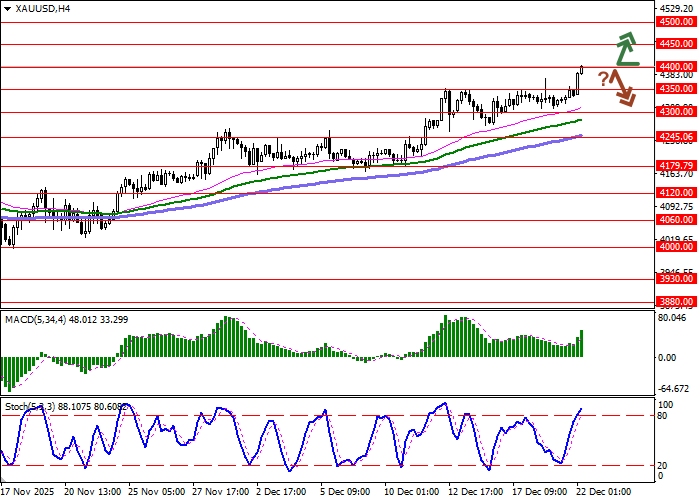
On the daily chart, Bollinger Bands continue to trend higher, with the price range expanding, although momentum has yet to fully match the recent surge in bullish sentiment. The MACD indicator is rising and maintains a strong buy signal, with the histogram positioned above the signal line. The Stochastic oscillator remains near the 80 level and is moving mostly sideways, pointing to moderate overbought conditions in gold over the very short term.
Resistance levels: 4400.00, 4450.00, 4500.00, 4550.00.
Support levels: 4350.00, 4300.00, 4245.06, 4179.79.
Trading scenarios and XAU/USD forecast
Long positions may be opened after a confident breakout above the 4400.00 level, targeting 4500.00. Stop-loss: 4350.00. Time horizon: 1–2 days.
A rebound from the 4400.00 resistance level followed by a break below 4350.00 could signal opportunities to open new short positions with a target at 4245.06. Stop-loss: 4400.00.
Scenario
| Timeframe | Intraday |
| Recommendation | BUY |
| Entry point | 4415.25 |
| Take Profit | 4500.00 |
| Stop Loss | 4350.00 |
| Key levels | 4179.79, 4245.06, 4300.00, 4350.00, 4400.00, 4450.00, 4500.00, 4550.00 |
Alternative scenario
| Recommendation | SELL STOP |
| Entry point | 4349.95 |
| Take Profit | 4245.06 |
| Stop Loss | 4400.00 |
| Key levels | 4179.79, 4245.06, 4300.00, 4350.00, 4400.00, 4450.00, 4500.00, 4550.00 |
