

According to macroeconomic data released last Friday, the U.S. Consumer Price Index fell from 2.7% to 2.4% year-on-year, marking the lowest level since May last year, while the monthly figure eased from 0.3% to 0.2% against consensus forecasts of 2.5% and 0.3%, respectively. At the same time, the core CPI, which excludes food and energy prices, adjusted from 2.6% to 2.5% year-on-year and from 0.2% to 0.3% month-on-month. The food index rose by 0.2% over the month, including a 0.2% increase in food at home and a 0.1% rise in food away from home, partially offset by a 1.5% decline in energy prices in January. As a result, key U.S. household expenses (food, gasoline, and housing) remain on average 25.0% above pre-COVID-19 levels, while the share of delinquent household debt, including mortgages and credit cards, climbed to 4.8% in the fourth quarter, the highest since 2017, largely due to defaults among younger borrowers and low-income households. A CBS News survey showed that in February only 34.0% of respondents rated the U.S. economy as “very” or “relatively” good, while 60.0% described it as “very” or “relatively” bad. Following the inflation release, yields on 10-year U.S. Treasuries adjusted to the 4.08–4.10% range, reflecting pressure on risk-free returns amid growing expectations of monetary easing. The USDX also extended its decline and is now holding near 96.8 points, signaling a reallocation of capital toward assets less sensitive to interest-rate fluctuations, such as gold, alongside a reduction in the appeal of the U.S. dollar as forward rate expectations are revised. The corrective movement in precious metals is accompanied by changes in market expectations regarding the Federal Reserve’s next steps. The CME FedWatch Tool indicates the likelihood of three gradual rate cuts in 2026—in June, September, and December—making the release of the latest FOMC meeting minutes on February 18 a key indicator of consensus views and voting dynamics within the committee. At the same time, upcoming December data on capital goods orders may provide additional signals on corporate activity and investment trends, particularly given forecasts for a decline in durable goods orders after strong growth in the previous period.
Meanwhile, according to the U.S. Commodity Futures Trading Commission (CFTC), net speculative positions in gold edged down last week to 160.0 thousand from 165.6 thousand previously. However, investors continue to hold sizeable long positions. The balance of “bulls” in positions backed by real money stands near 116.157 thousand versus 23.119 thousand for “bears.” Last week, buyers closed 1.053 thousand contracts, while sellers closed 0.654 thousand, confirming the persistence of a corrective phase in the asset.
Support and Resistance Levels
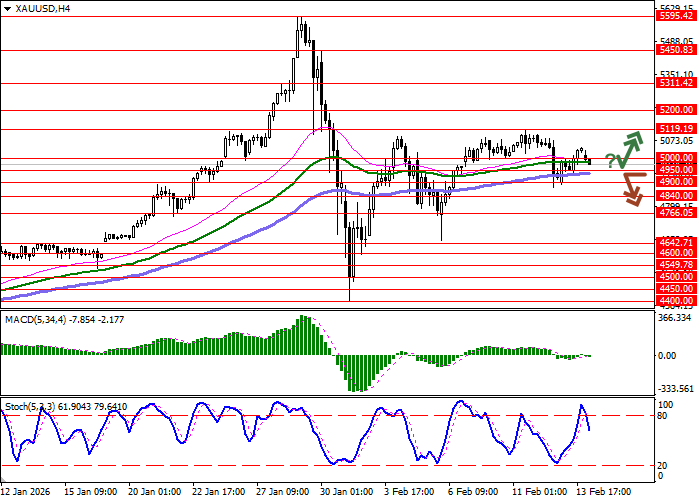
On the daily chart, Bollinger Bands are attempting to turn lower, with the price range narrowing from above while remaining sufficiently wide for the current level of market activity. The MACD maintains its prior sell signal, staying below the signal line, while the Stochastic oscillator continues to point to the development of a full-fledged bearish correction in the near term.
Resistance levels: 5000.00, 5119.19, 5200.00, 5311.42.
Support levels: 4950.00, 4900.00, 4840.00, 4766.05.
Trading Scenarios and XAU/USD Outlook
Short positions may be opened after a confident break below the 4950.00 level, targeting 4840.00. Stop-loss: 5000.00. Time horizon: 1–2 days.
A rebound from the 4950.00 support level followed by a breakout above 5000.00 could signal the opening of long positions with a target at 5119.19. Stop-loss: 4950.00.
Scenario
| Timeframe | Intraday |
| Recommendation | SELL STOP |
| Entry point | 4949.95 |
| Take Profit | 4840.00 |
| Stop Loss | 5000.00 |
| Key levels | 4766.05, 4840.00, 4900.00, 4950.00, 5000.00, 5119.19, 5200.00, 5311.42 |
Alternative scenario
| Recommendation | BUY STOP |
| Entry point | 5000.05 |
| Take Profit | 5119.19 |
| Stop Loss | 4950.00 |
| Key levels | 4766.05, 4840.00, 4900.00, 4950.00, 5000.00, 5119.19, 5200.00, 5311.42 |
