

The alliance agreed to raise production by only 137,000 barrels per day, compared with earlier discussions of 500,000 barrels per day over three months. Analysts at ANZ Bank said the restrained adjustment is justified given rising risks of supply disruptions caused by tightening U.S. and European sanctions on Russia and Iran. A draft proposal reportedly includes a 500% tariff on Russian oil, gas, petroleum products, and uranium imports. In parallel, sanctions lifted under the 2015 nuclear deal were reinstated against Tehran. Meanwhile, The Wall Street Journal noted that China continues to purchase Iranian oil via barter, facilitated by insurance firm Sinosure Corp. and financial company Chuxin. Roughly $8.4 billion from these transactions last year was directed toward Chinese projects in Iran, and total Chinese investment in the country’s infrastructure has reached $25 billion since the early 2000s.
Geopolitics also influence oil markets. U.S. President Donald Trump announced that Israel and Hamas have agreed to the first phase of a peace plan to end hostilities in Gaza. The ceasefire agreement will reportedly be signed during his visit to Egypt this weekend. Early next week, Israel may begin releasing Palestinian prisoners in exchange for hostages, while partially withdrawing its troops to pre-agreed lines inside the enclave.
According to industry data, U.S. commercial crude inventories rose by 3.715 million barrels last week, exceeding the forecast of 2.25 million barrels. At the same time, stockpiles at the NYMEX delivery hub in Cushing declined by 763,000 barrels, following a 271,000-barrel drop the previous week. Another factor that could impact prices is the upcoming Baker Hughes rig count report, due at 19:00 (GMT+2). The number of active rigs increased in September and may continue to rise from the current 422 units.
Support and Resistance Levels
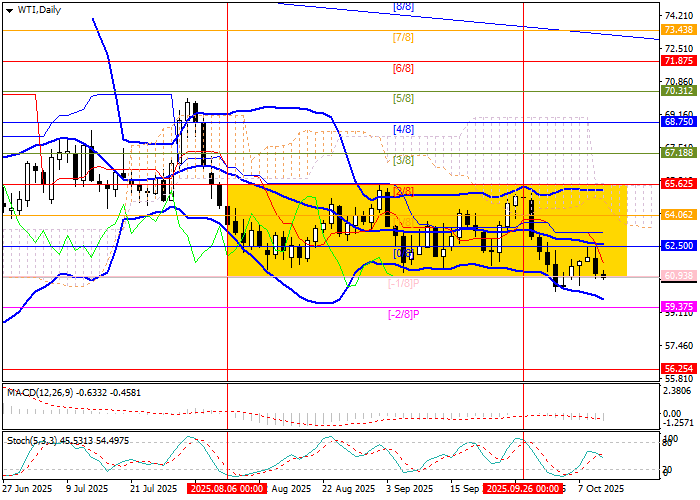
Prices remain within a long-term downtrend, although the market has stabilized in a sideways channel between 65.62–60.93 (Murray levels [2/8]–[–1/8]) in recent months. The price is currently testing the lower boundary; a breakout below this zone would open the way toward 59.37 ([–2/8]) and 56.25 ([2/8], W1). A rebound and consolidation above 62.50 ([0/8]) supported by the midline of Bollinger Bands could trigger a return to the upper boundary near 65.62.
Technical indicators suggest a continuation of the decline: Bollinger Bands and the Stochastic oscillator are turning lower, while MACD remains in the negative zone.
Resistance Levels: 62.50, 65.62.
Support Levels: 60.93, 59.37, 56.25.
Trading Scenarios for WTI Crude Oil
Short positions may be opened below 60.93 with targets at 59.37 and 56.25, and a stop-loss at 62.00. Estimated timeframe: 5–7 days.
Long positions may be opened above 62.50 with targets at 65.62 and a stop-loss at 60.90.
Scenario
| Timeframe | Weekly |
| Recommendation | SELL STOP |
| Entry Point | 60.90 |
| Take Profit | 59.37, 56.25 |
| Stop Loss | 62.00 |
| Key Levels | 56.25, 59.37, 60.93, 62.50, 65.62 |
Alternative Scenario
| Recommendation | BUY STOP |
| Entry Point | 60.95 |
| Take Profit | 62.50, 65.62 |
| Stop Loss | 60.90 |
| Key Levels | 56.25, 59.37, 60.93, 62.50, 65.62 |