

Industrial production growth in China slowed to 4.8% in November from 4.9%, missing expectations of 5.0%, while retail sales growth decelerated sharply from 2.9% to 1.3%. This weaker data may prompt Chinese monetary authorities to introduce additional support measures.
In the United States, data on the New York Fed manufacturing activity index will be released today at 15:30 (GMT+2). The index is expected to fall significantly from 18.7 points to 10.6 points, which could put notable pressure on the US dollar. At 17:00 (GMT+2), investors will also focus on December housing market data from the National Association of Home Builders (NAHB), with the index forecast to rise slightly from 38.0 to 39.0 points.
Tomorrow at 00:00 (GMT+2), Australia will publish December business activity data from S&P Global. In the previous month, the manufacturing PMI stood at 51.6 points, while the services PMI was recorded at 52.8 points.
Meanwhile, the US Department of Labor will release the delayed November employment report at 15:30 (GMT+2). The data was not published earlier due to the government shutdown and could significantly influence the future direction of Federal Reserve monetary policy. Currently, Fed officials project only one rate cut, while market participants continue to price in two adjustments, citing rapidly easing inflation risks.
Last week, the Federal Reserve cut interest rates by 25 basis points to 3.75% and left its projections for 2026 and 2027 unchanged. At the same time, members of the Federal Open Market Committee (FOMC) improved their preliminary assessments regarding inflation dynamics and economic growth in the near term.
Additional support for the AUD/USD pair comes from expectations that the Reserve Bank of Australia (RBA) will not rush to cut rates again in early 2026. In early December, the RBA unanimously kept its policy rate unchanged at 3.60%.
In its accompanying statement, the central bank noted that economic activity continues to recover amid easing financial conditions. At the same time, RBA Governor Michele Bullock stated that the board does not rule out the possibility of a rate hike if economic conditions require such a move.
Support and resistance levels
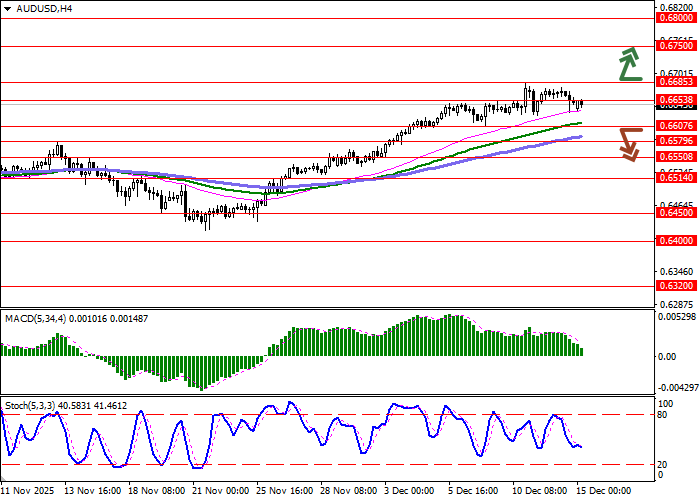
On the daily chart, Bollinger Bands indicate steady upward movement, while the narrowing price range reflects mixed trading conditions in the very short term. The MACD is moving lower, maintaining a relatively strong sell signal as the histogram attempts to slip below the signal line.
The Stochastic oscillator shows a similar pattern, retreating from the 80 level, which previously signaled moderate overbought risks for the Australian dollar in the near term.
Resistance levels: 0.6653, 0.6685, 0.6750, 0.6800.
Support levels: 0.6607, 0.6579, 0.6550, 0.6514.
Trading scenarios and AUD/USD outlook
Short positions may be considered after a confident break below 0.6607, with a target at 0.6514. Stop-loss: 0.6653. Time horizon: 2–3 days.
A return of bullish momentum followed by a breakout above 0.6685 could serve as a signal to open new long positions, targeting 0.6800. Stop-loss: 0.6630.
Scenario
| Timeframe | Intraday |
| Recommendation | SELL STOP |
| Entry point | 0.6605 |
| Take Profit | 0.6514 |
| Stop Loss | 0.6653 |
| Key levels | 0.6514, 0.6550, 0.6579, 0.6607, 0.6653, 0.6685, 0.6750, 0.6800 |
Alternative scenario
| Recommendation | BUY STOP |
| Entry point | 0.6685 |
| Take Profit | 0.6800 |
| Stop Loss | 0.6630 |
| Key levels | 0.6514, 0.6550, 0.6579, 0.6607, 0.6653, 0.6685, 0.6750, 0.6800 |