
The main factor putting pressure on the euro remains the situation in the Middle East. Countries in the bloc are heavily dependent on liquefied natural gas supplies, and news about the shutdown of one of the largest QatarEnergy facilities — responsible for nearly 20.0% of global LNG supply — pushed prices to a peak of $800.0 per thousand cubic meters. The price has since corrected to around $600.0 per thousand cubic meters, still significantly higher than the average range of $350.0–400.0 before the closure of the Strait of Hormuz. Further declines in the single currency are being limited by the rise in the EU services PMI from 51.8 to 51.9 in February and the S&P Global composite index remaining unchanged at 51.9, as well as a decline in unemployment from 6.2% to 6.1%, compared with forecasts of 6.2%.
The US dollar, which largely determines the pair’s dynamics, remains volatile. Today it is trading near 98.90 on the USDX index and may continue the local upward trend that began after the first reports of a military confrontation between the United States and Iran. Investors are actively withdrawing capital from real assets and reallocating it to the most reliable commodity assets and safe-haven currencies, including the US dollar. However, the median forecast from 60 analysts surveyed by Reuters in its monthly poll — conducted mostly after the outbreak of hostilities in the Persian Gulf region — suggests further weakening of the US currency. The dollar may fall by about 2.0% to $1.18 per euro by the end of March, then reach $1.19 within three months and $1.20 within six months. Analysts note that these forecasts have changed little compared with the previous month’s survey. Long-term expectations remain less certain: the median estimate suggests the rate may reach $1.21 per euro within a year, although the spread of forecasts among analysts reaches about 18 cents — one of the widest ranges in Reuters surveys since last October.
The dollar also received short-term support after the release of the preliminary February report from Automatic Data Processing (ADP), which showed that employment in the US private sector increased by 63.0K jobs compared with 11.0K previously.
Support and Resistance Levels
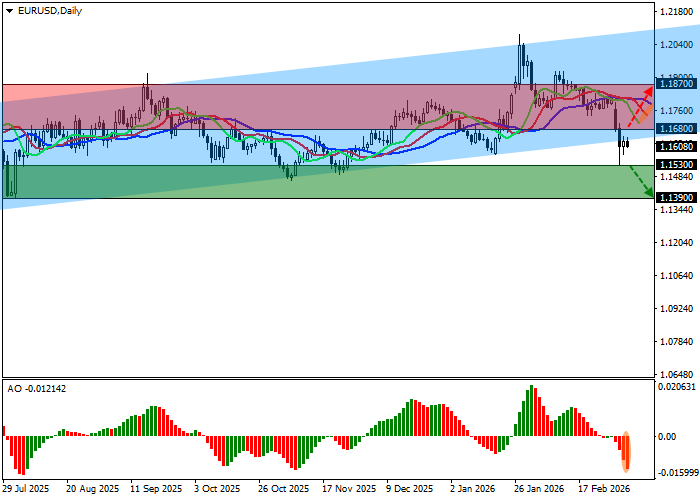
On the daily chart, the instrument is correcting after pulling back from the support line of a local ascending channel with boundaries at 1.2120–1.1620.
Technical indicators are strengthening the sell signal received earlier this week: the fast EMAs of the Alligator indicator remain slightly below the signal line, expanding the fluctuation range, while the Awesome Oscillator histogram forms corrective bars in the negative zone.
Resistance levels: 1.1680, 1.1870.
Support levels: 1.1530, 1.1390.
Trading Scenarios and EUR/USD Forecast
Short positions can be opened after the price declines and consolidates below 1.1530 with a target at 1.1390. Stop-loss — 1.1600. Implementation period: 7 days or more.
Long positions can be opened after the price rises and consolidates above 1.1680 with a target at 1.1870. Stop-loss — 1.1620.
Scenario
| Timeframe | Weekly |
| Recommendation | SELL STOP |
| Entry Point | 1.1525 |
| Take Profit | 1.1390 |
| Stop Loss | 1.1600 |
| Key Levels | 1.1390, 1.1530, 1.1680, 1.1870 |
Alternative Scenario
| Recommendation | BUY STOP |
| Entry Point | 1.1685 |
| Take Profit | 1.1870 |
| Stop Loss | 1.1620 |
| Key Levels | 1.1390, 1.1530, 1.1680, 1.1870 |
