

The stock came under renewed investor pressure after media reports suggested that U.S. Immigration Service raids in the company’s parking lots and stores were allegedly based on data provided by The Home Depot Inc. employees to law enforcement agencies.
The company’s stores use the Flock Safety system, which scans vehicle license plates and records video footage intended for internal security purposes. In practice, however, this data may also be shared with government authorities, which can use it at their own discretion, including transferring it to immigration services. Against this backdrop, several major investors, including Zevin Asset Management, Walmart Inc., and Amazon.com Inc., have requested official clarification from the company on how Flock Safety data is used, stating they do not want to be involved in potential government actions against the public.
Experts warn that such practices could create legal and financial risks for management, especially if investors begin to reduce exposure or withdraw capital en masse, potentially impacting market capitalization and corporate reputation. Questions also remain regarding what specific control measures the company plans to implement, how effective they will be in practice, how regulators, human rights organizations, and shareholders will respond, and what the potential consequences may be for consumer trust.
As for the company’s quarterly results, the fourth-quarter report is scheduled for release on February 24. Revenue is expected at $38.14 billion, significantly below the previous quarter’s $41.4 billion and also under $39.7 billion reported in the same period last year. Earnings per share are forecast at $2.54, compared with $3.74 and $3.13, respectively.
The date of the next dividend payment has not yet been announced. On December 18, 2025, shareholders received $2.30 per share, corresponding to a quarterly yield of 2.57%, which remains slightly above the sector’s median level of 2.16%.
Support and Resistance Levels
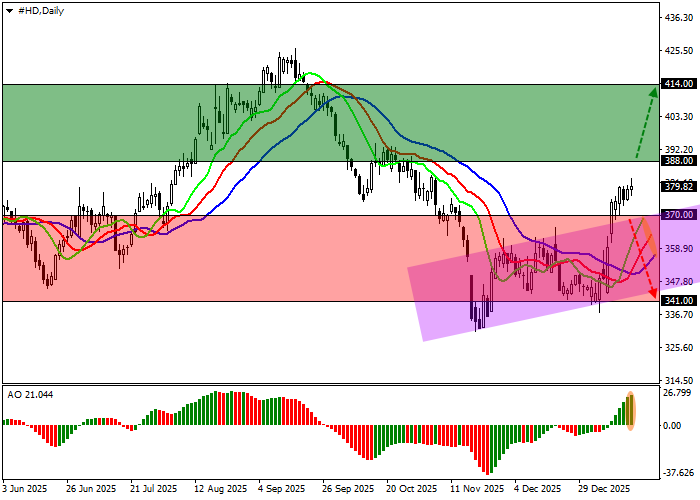
On the daily chart, the asset is correcting near the resistance line of a recently completed local ascending channel with dynamic boundaries at 370.00–345.00.
Technical indicators maintain a stable buy signal: fast EMAs on the Alligator indicator remain above the signal line, while the AO histogram is forming corrective bars in the buying zone.
Support levels: 370.00, 341.00.
Resistance levels: 388.00, 414.00.
Trading Scenarios and The Home Depot Price Forecast
If growth resumes and the price consolidates above the 388.00 resistance level, long positions will be relevant with a target at 414.00. Stop loss — 380.00. Time horizon: 7 days or more.
If the decline continues and the price consolidates below the 370.00 support level, short positions may be opened with a target at 341.00 and a stop loss at 380.00.
Scenario
| Timeframe | Weekly |
| Recommendation | BUY STOP |
| Entry Point | 388.05 |
| Take Profit | 414.00 |
| Stop Loss | 380.00 |
| Key Levels | 341.00, 370.00, 388.00, 414.00 |
Alternative Scenario
| Recommendation | SELL STOP |
| Entry Point | 369.95 |
| Take Profit | 341.00 |
| Stop Loss | 380.00 |
| Key Levels | 341.00, 370.00, 388.00, 414.00 |
