

Traders’ attention is primarily focused on inflation expectations from the University of Michigan, which are preliminarily expected to remain unchanged. One-year inflation expectations are currently seen at 4.1%, while five-year expectations are projected to ease to 3.2%. However, these figures may be revised following the recent slowdown in US consumer inflation, with headline CPI decelerating from 3.0% to 2.7% year-on-year, compared with forecasts of an increase to 3.1%. Core CPI, excluding food and energy prices, also eased from 3.0% to 2.6%.
These data reinforce expectations of a more dovish stance from the Federal Reserve in 2026, even though policymakers currently project only one 25-basis-point rate cut, while market participants are pricing in at least two reductions. At its final meeting of the year, the Fed lowered borrowing costs by 25 basis points to a range of 3.50%–3.75%. Chicago Fed President Austan Goolsbee and Kansas City Fed President Jeffrey Schmid dissented, favoring no change, while Governor Steven Miran supported a larger 50-basis-point cut. These divisions are likely to persist until inflation is fully contained or labor market conditions deteriorate more sharply.
Investors also continue to assess the US labor market report for November, which was released nearly two weeks late due to the shutdown, meaning the Fed made its policy decision without a complete set of data. In October, nonfarm payrolls declined by 105,000 following a gain of 108,000 the previous month, while November payrolls increased by 64,000, beating forecasts of 50,000. Meanwhile, average hourly earnings growth slowed from 0.4% to 0.1% month-on-month, and from 3.7% to 3.5% year-on-year, pointing to easing inflationary pressures.
The most negative development was the rise in the unemployment rate in November, which climbed from 4.4% to 4.6%, contrary to expectations for no change, signaling further cooling in the US labor market.
Support and resistance levels
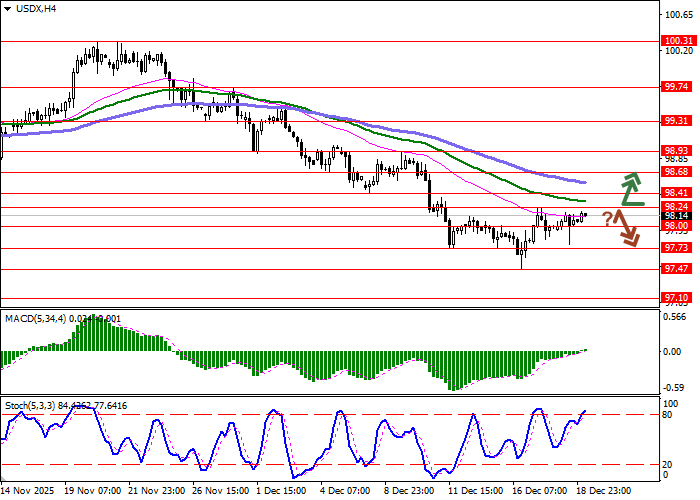
On the daily chart, Bollinger Bands are trending lower, with the price range narrowing and reflecting mixed short-term trading dynamics. The MACD continues to rise, maintaining a buy signal as the histogram remains above the signal line.
The Stochastic oscillator is rapidly approaching overbought territory, indicating increased risks of short-term correction.
Resistance levels: 98.24, 98.41, 98.68, 98.93.
Support levels: 98.00, 97.73, 97.47, 97.10.
Trading scenarios and USDX forecast
Long positions may be opened after a confident breakout above 98.24, targeting 98.68. Stop-loss: 98.00. Time horizon: 1–2 days.
Short positions may be considered after a rejection from 98.24 followed by a breakdown below 98.00, targeting 97.47. Stop-loss: 98.24.
