
According to data on international securities transactions, foreign investors increased their holdings of Canadian assets by a total of CAD 46.6 billion in October, the highest level since March 2022, while Canadian forex traders reduced their foreign asset holdings by CAD 11.6 billion, marking the first capital outflow since January. Overall, these transactions supported the national economy by CAD 58.2 billion, also a peak since March 2022. The most popular asset classes among buyers were debt securities (CAD 34.0 billion) and equities (CAD 12.6 billion), while the reduction in foreign bond holdings was mainly related to U.S. equities (–CAD 6.6 billion) and debt instruments (–CAD 4.0 billion).
The U.S. dollar continues its uneven upward movement, rising to 98.00 on the USDX from Monday’s low of 97.40. This week is filled with speeches by heads of regional Federal Reserve banks. One of the potential candidates for the position of Fed Chair, Christopher Waller, has revised his stance, stating that officials may continue adjusting interest rates amid a cooling labor market. This contrasts both with his earlier position and with comments from Atlanta Federal Reserve Bank President Raphael Bostic, who noted that he does not view the recent monetary easing decision as appropriate and argued that borrowing costs should have been fixed throughout 2026 while conducting a thorough assessment of potential inflationary pressures. Today at 15:30 (GMT+2), inflation data will be released: in November, the consumer price index is expected to reach 0.3% month-on-month and rise from 3.0% to 3.1% year-on-year, while the core indicator closely watched by analysts is expected to remain at 3.0%. For now, traders remain focused on labor market data: during the same period, the unemployment rate increased from 4.4% to 4.6%, exceeding forecasts of 4.5% and reaching its highest level since 2021; nonfarm payrolls rose from –105.0 thousand to 64.0 thousand, private nonfarm employment increased to 69.0 thousand versus expectations of 45.0 thousand, and average hourly earnings accelerated from 0.2% to 0.4%.
Support and resistance levels
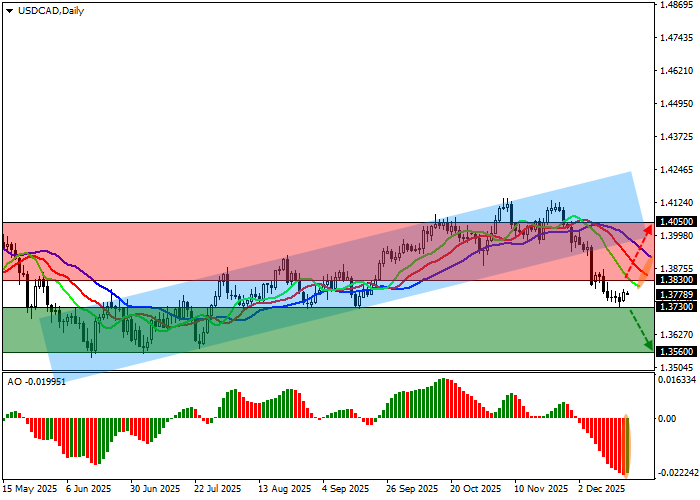
On the daily chart, the instrument remains below the support line of the ascending channel with boundaries at 1.4250–1.3940.
Technical indicators are strengthening the sell signal: the EMA range of the Alligator indicator is expanding, fast EMAs are moving away from the signal line, and the AO histogram is forming corrective bars well below the zero line.
Resistance levels: 1.3830, 1.4050.
Support levels: 1.3730, 1.3560.
Trading scenarios and USD/CAD forecast
Short positions can be opened after the price declines and consolidates below the 1.3730 level, with a target at 1.3560. Stop loss — 1.3800. Time horizon: 7 days or more.
Long positions can be opened after the price rises and consolidates above the 1.3830 level, with a target at 1.4050. Stop loss — 1.3750.
Scenario
| Timeframe | Weekly |
| Recommendation | SELL STOP |
| Entry point | 1.3730 |
| Take Profit | 1.3560 |
| Stop Loss | 1.3800 |
| Key levels | 1.3560, 1.3730, 1.3830, 1.4050 |
Alternative scenario
| Recommendation | BUY STOP |
| Entry point | 1.3830 |
| Take Profit | 1.4050 |
| Stop Loss | 1.3750 |
| Key levels | 1.3560, 1.3730, 1.3830, 1.4050 |
