

As expected, the regulator kept the interest rate unchanged at 0.50%. Seven members of the Monetary Policy Committee voted in favor of maintaining the rate, while two (Hajime Takata and Naoki Tamura) supported tightening, citing rising inflationary pressures. Recent macroeconomic data showed a slight acceleration in Japan’s consumer price index, which remains above the 2.0% target. Officials are also likely acting in line with the approach of new Prime Minister Sanae Takaichi, known for her dovish stance and plans to expand fiscal spending and restart stimulus programs.
Meanwhile, U.S. investors are analyzing the outcome of the Federal Reserve’s meeting. As expected, the Fed cut borrowing costs by 25 basis points to 4.00% and noted a slow pace of economic growth. It is important to note that policymakers currently lack access to official employment data due to the ongoing government shutdown, which could become the longest in U.S. history. The federal government has been inactive for nearly a month, with no compromise yet between Democrats and Republicans.
On Friday at 01:50 (GMT+2), Japan will release September data on industrial production and retail sales. Forecasts suggest that output will rebound by 1.5% after a 1.5% decline in the previous month, while retail sales are expected to increase by 0.7% after falling 1.1% earlier.
Support and Resistance Levels
Bollinger Bands on the daily chart show a sideways movement, with the price range widening upward — opening the path for bulls to new local highs. MACD has turned upward, preparing to generate a buy signal as the histogram approaches the signal line. Stochastic, after a brief decline earlier this week, is flattening out, reflecting mixed short-term market dynamics. Traders should wait for clearer confirmation from the indicators.
Resistance levels: 153.00, 153.70, 154.50, 155.00.
Support levels: 152.24, 151.50, 150.93, 150.50.
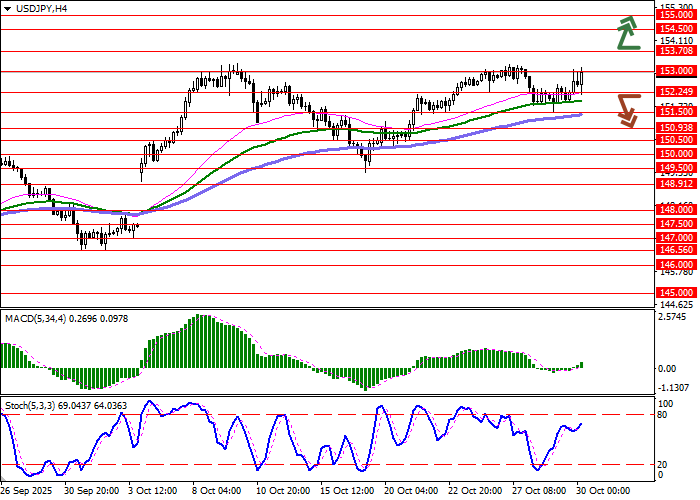
Trading Scenarios and USD/JPY Forecast
Long positions may be opened after a confident breakout above 153.70, with a target at 155.00. Stop-loss — 153.00. Implementation period: 2–3 days.
A return of bearish momentum with a breakdown below 152.24 may signal new short positions with a target at 150.93. Stop-loss — 153.00.
Scenario
| Timeframe | Intraday |
| Recommendation | BUY STOP |
| Entry Point | 153.75 |
| Take Profit | 155.00 |
| Stop Loss | 153.00 |
| Key Levels | 150.50, 150.93, 151.50, 152.24, 153.00, 153.70, 154.50, 155.00 |
Alternative Scenario
| Recommendation | SELL STOP |
| Entry Point | 152.20 |
| Take Profit | 150.93 |
| Stop Loss | 153.00 |
| Key Levels | 150.50, 150.93, 151.50, 152.24, 153.00, 153.70, 154.50, 155.00 |