

The main factor behind the prevailing bearish backdrop remains expectations of a potential peaceful resolution of the Russia–Ukraine conflict, reportedly mediated by the Republican administration in the White House. Such an outcome could lead to a return of significant volumes of hydrocarbons to global markets. In addition, traders remain concerned about the state of the global economy, which continues to slow and may further reduce demand. Analysts at Barclays Plc. estimate that the average oil price in 2026 could settle around $65.0 per barrel, noting that the current oversupply is already largely priced in. If additional supply volumes are ramped up gradually, investors may have time to adjust, avoiding a sharp sell-off in the asset.
Meanwhile, the price of Russian crude shipped from Baltic and Black Sea ports, as well as from the eastern port of Kozmino, has fallen to its lowest level since February 2022—nearly $40.0 per barrel, according to Bloomberg, citing data from Argus Media. The primary reason is US sanctions against Rosneft and Lukoil, which have complicated energy exports and forced producers to offer deeper discounts to buyers. Declining export revenues are putting pressure on corporate finances and reducing tax inflows to the state budget, around a quarter of which is generated by oil and gas sales.
US investors, for their part, are assessing labour market data that were released with delays due to the aftermath of the record 43-day government shutdown. In October, nonfarm payrolls fell by 105.0K following a gain of 108.0K, while November figures were revised to an increase of 64.0K, exceeding expectations of 50.0K. Average hourly earnings slowed from 0.4% to 0.1% month-on-month, below forecasts of 0.3%, and from 3.7% to 3.5% year-on-year. The weakening wage dynamics may indirectly signal further easing of inflationary pressures, which the Federal Reserve still views as a key argument for maintaining its current monetary policy stance. In addition, the unemployment rate rose from 4.4% to 4.6%, contrary to expectations of no change.
In addition, traders are closely watching data from the American Petroleum Institute (API) on US commercial fuel inventories for the week ending December 12: stocks fell from –4.8 million barrels to –9.3 million barrels, compared with market expectations of –2.2 million barrels.
Support and Resistance Levels
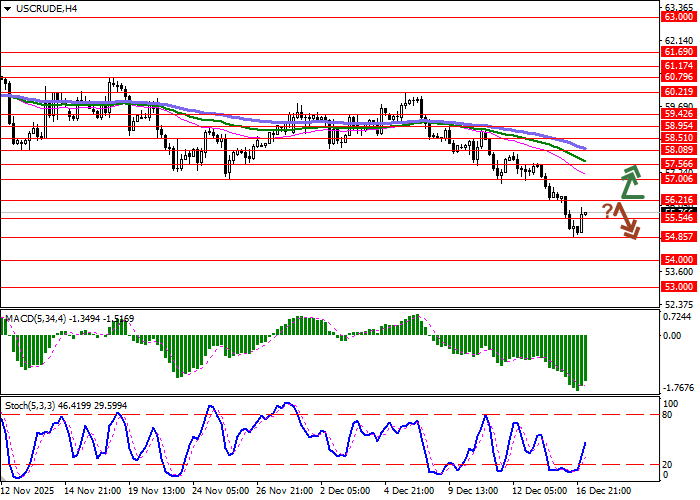
On the daily chart, Bollinger Bands are trending firmly lower as the price range expands, although it is not fully keeping pace with short-term bearish momentum. The MACD continues to decline, maintaining a strong sell signal (the histogram remains below the signal line), while the Stochastic oscillator, after approaching its lowest levels, is attempting to turn higher in response to the corrective rebound, pointing to elevated short-term oversold risks.
Resistance levels: 56.21, 57.00, 57.56, 58.08.
Support levels: 55.54, 54.85, 54.00, 53.00.
Trading Scenarios and Oil Price Forecast
Long positions can be opened after a breakout above 56.21, targeting 57.56. Stop-loss: 55.54. Time horizon: 1–2 days.
Short positions can be opened after a pullback from 56.21 and a breakdown below 55.54, targeting 54.00. Stop-loss: 56.21.
Scenario
| Timeframe | Intraday |
| Recommendation | BUY STOP |
| Entry point | 56.25 |
| Take Profit | 57.56 |
| Stop Loss | 55.54 |
| Key levels | 53.00, 54.00, 54.85, 55.54, 56.21, 57.00, 57.56, 58.08 |
Alternative Scenario
| Recommendation | SELL STOP |
| Entry point | 55.50 |
| Take Profit | 54.00 |
| Stop Loss | 56.21 |
| Key levels | 53.00, 54.00, 54.85, 55.54, 56.21, 57.00, 57.56, 58.08 |
