
On the previous day, Minneapolis Federal Reserve Bank President Neel Kashkari expressed concern about persistently high price pressures, which, in his view, could remain elevated for several years due to higher tariffs. His Richmond Fed counterpart Thomas Barkin noted that unemployment remains relatively low by historical standards, while inflation is still above the 2.0% target, meaning that further interest-rate decisions should be based strictly on incoming macroeconomic data. Support for easing policy was also voiced by Fed Governor Stephen Miran, appointed by President Trump. In an interview with Fox Business, he said that cutting borrowing costs by 100 basis points over the year would be appropriate, although such an aggressive move is backed by only a minority of policymakers.
Meanwhile, conditions in the eurozone are forming for the continuation of a dovish stance. Since mid-2024, the European Central Bank (ECB) has repeatedly lowered borrowing costs, and many officials have hinted that this easing cycle may already be complete. However, the latest data confirm a moderate economic slowdown: the composite PMI fell to 51.3 points in December, while Germany’s December consumer price index stood at 1.8%, below the ECB’s target. Against this backdrop, analysts expect borrowing costs to remain low in the coming months to support investment and consumption. At the same time, risks linked to geopolitical uncertainty and fluctuations in energy prices persist, which could weigh on economic growth.
Support and resistance levels
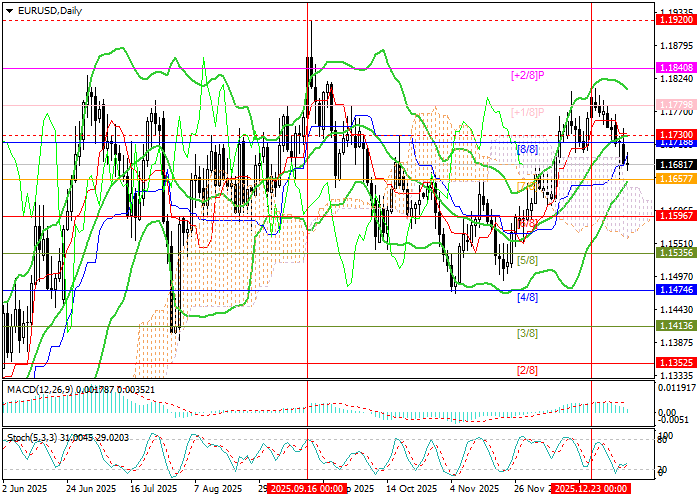
From a technical perspective, EUR/USD is approaching the 1.1657 level (Murray level [7/8]), reinforced by the lower Bollinger Band. A break below this area could trigger a decline toward 1.1596 (Murray level [6/8]) and 1.1535 (Murray level [5/8]). The key level for bulls is seen at the middle Bollinger Band at 1.1730: a sustained move above it would act as a catalyst for growth toward 1.1840 (Murray level [+2/8]) and 1.1920 (the September highs).
Technical indicators do not provide a unified signal: Bollinger Bands are pointing upward, the Stochastic oscillator is moving sideways near the oversold zone, while the MACD histogram is declining in positive territory.
Resistance levels: 1.1730, 1.1840, 1.1920.
Support levels: 1.1657, 1.1596, 1.1535.
Trading scenarios and EUR/USD forecast
Short positions can be considered below 1.1657, with targets at 1.1596 and 1.1535 and a stop-loss at 1.1700. Time horizon: 5–7 days.
Long positions can be considered above 1.1730, with targets at 1.1840 and 1.1920 and a stop-loss at 1.1665.
Scenario
| Timeframe | Weekly |
| Recommendation | SELL STOP |
| Entry point | 1.1655 |
| Take Profit | 1.1596, 1.1535 |
| Stop Loss | 1.1700 |
| Key levels | 1.1535, 1.1596, 1.1657, 1.1730, 1.1840, 1.1920 |
Alternative scenario
| Recommendation | BUY STOP |
| Entry point | 1.1730 |
| Take Profit | 1.1840, 1.1920 |
| Stop Loss | 1.1665 |
| Key levels | 1.1535, 1.1596, 1.1657, 1.1730, 1.1840, 1.1920 |
