

Following the launch of the US military operation “Midnight Hammer” and the subsequent arrest of Venezuelan President Nicolás Maduro and his wife Cilia Flores on charges of narco-terrorism, investors have been actively reallocating capital into traditional safe-haven assets, particularly precious metals, in an effort to hedge potential risks. In addition, gold prices are being supported by market confidence that the US Federal Reserve will continue easing monetary policy, which could significantly weaken the US dollar over the long term. Analysts do not rule out a pause in rate cuts at the beginning of the year, but still expect the regulator to return to a dovish stance later on. This shift could be facilitated by a change in Fed leadership. Jerome Powell’s four-year term ends in May, and Kevin Hassett—actively promoted by the Republican administration in the White House—is currently considered the leading candidate to succeed him. Most analysts and market participants expect interest rates to be adjusted at least twice this year, while Federal Reserve Board member Stephen Miran has not ruled out a cumulative cut of 100 basis points, implying three or even four rate reductions.
It is also worth noting that, according to Bloomberg, gold has now become the world’s largest reserve asset for central banks, surpassing the US dollar. This trend reflects regulators’ efforts to diversify reserves amid geopolitical uncertainty, rising sanctions risks, and persistently elevated inflation expectations.
Support and resistance levels
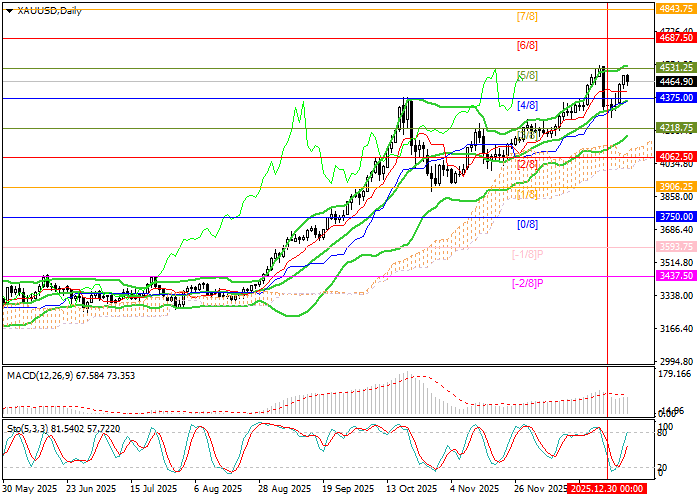
From a technical perspective, the price is approaching the 4531.00 level (Murray level [5/8]). A sustained breakout above this area would open the way for further gains toward 4687.50 (Murray level [6/8]) and 4843.75 (Murray level [7/8]). For bears, the key level is seen at 4375.00 (Murray level [4/8]), reinforced by the middle line of the Bollinger Bands. A breakdown below this support would signal a corrective move toward 4062.50 (Murray level [2/8]) and 3906.25 (Murray level [1/8]).
Technical indicators confirm the persistence of the bullish trend: the Bollinger Bands and Stochastic oscillator are pointing upward, while the MACD histogram continues to expand in positive territory.
Resistance levels: 4531.00, 4687.50, 4843.75.
Support levels: 4375.00, 4062.50, 3906.25.
Trading scenarios and XAU/USD outlook
Long positions can be opened above 4531.00 with targets at 4687.50 and 4843.75, and a stop-loss at 4415.00. Time horizon: 5–7 days.
Short positions can be opened below 4375.00 with targets at 4062.50 and 3906.25, and a stop-loss at 4500.00.
Scenario
| Timeframe | Weekly |
| Recommendation | BUY STOP |
| Entry point | 4531.00 |
| Take Profit | 4687.50, 4843.75 |
| Stop Loss | 4415.00 |
| Key levels | 3906.25, 4062.50, 4375.00, 4531.00, 4687.50, 4843.75 |
Alternative scenario
| Recommendation | SELL STOP |
| Entry point | 4375.00 |
| Take Profit | 4062.50, 3906.25 |
| Stop Loss | 4500.00 |
| Key levels | 3906.25, 4062.50, 4375.00, 4531.00, 4687.50, 4843.75 |
