

Despite progress in adding new wireless subscribers, the company’s quarterly revenue came in below analysts’ expectations. The uptick in new customers coincided with the launch of the iPhone 17: management, along with competitors, offered attractive purchase options for the new model, which lifted the mobile division’s revenue by 6.1% to $4.79 billion, while its operating expenses rose by 3.8%. AT&T Inc. saw the strongest performance in its wireless segment, adding 405.0 thousand new subscribers for the quarter, well above the 334.1 thousand expected. As a result, total net additions across all segments reached 558.0 thousand, the company’s highest quarterly increase in eight years. Nevertheless, the decline in the wireline services business continues: as more people abandon legacy communication methods, the segment’s revenue fell 7.8% in the quarter.
This week, the company reported third-quarter financial results showing revenue increased to $30.70 billion, up from $30.21 billion in the same period last year but slightly below $30.85 billion in the prior quarter, while earnings per share (EPS) decreased to $0.54 versus $0.60 and $0.62, respectively.
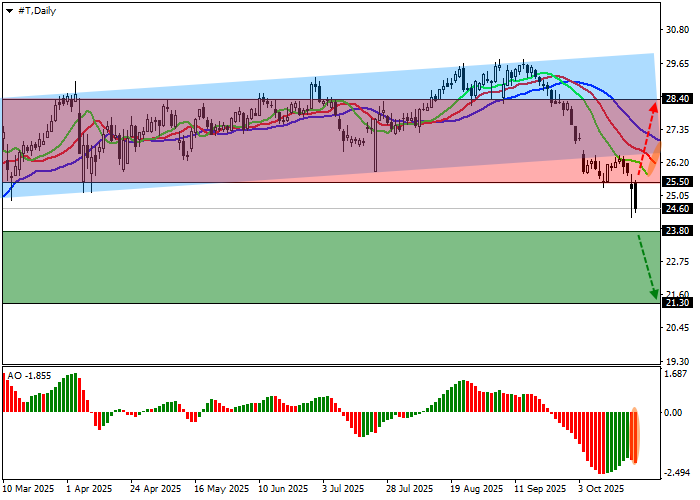
Support and resistance levels
On the daily chart, the price continues to trade below the support line of the ascending channel with dynamic boundaries at 30.00–26.00.
Technical indicators are poised to further strengthen the sell signal: the EMA range of the Alligator indicator is widening to the downside, while the AO histogram prints new corrective bars well below the zero line.
Support levels: 23.80, 21.30.
Resistance levels: 25.50, 28.40.
Trading scenarios and AT&T Inc share price outlook
If the decline continues and the price consolidates below the 23.80 support level, short positions become relevant with a target of 21.30. Stop-loss — 24.50. Timeframe: 7 days or more.
If the rise continues and the price consolidates above the 25.50 resistance level, consider long positions with a target of 28.40. Stop-loss — 24.50.
Scenario
| Timeframe | Weekly |
| Recommendation | SELL STOP |
| Entry point | 23.75 |
| Take Profit | 21.30 |
| Stop Loss | 24.50 |
| Key levels | 21.30, 23.80, 25.50, 28.40 |
Alternative scenario
| Recommendation | BUY STOP |
| Entry point | 25.55 |
| Take Profit | 28.40 |
| Stop Loss | 24.50 |
| Key levels | 21.30, 23.80, 25.50, 28.40 |
