

In particular, market focus remains on the Iran–US negotiations over the “nuclear deal,” which are balancing on the brink of a full-scale military conflict in the Middle East. The third round is scheduled for tomorrow in Geneva, but it will take place amid sharply increased pressure from the Republican administration in the White House. On February 19, President Donald Trump issued an ultimatum to Iran, giving the Islamic Republic 15 days to reach an agreement after the previous meeting delivered only limited progress, as deep disagreements over nuclear and regional security issues remained unresolved. The president also warned of possible limited airstrikes on Iranian infrastructure, including military and administrative facilities, if diplomatic efforts fail. The seriousness of these intentions has already been underscored by the US State Department’s evacuation of non-essential personnel from the embassy in Beirut. In addition, a buildup of US forces has been recorded in the region, further heightening market concerns, as a direct US–Iran confrontation would very likely lead to a reduction in crude oil supplies. Analysts estimate the geopolitical risk premium embedded in current prices at no less than $10.0 per barrel. A potential disruption of supplies through the Strait of Hormuz—through which around one-third of global seaborne oil exports pass—could trigger a global energy crisis and spark a sharp surge in energy prices. Analysts at financial conglomerate Barclays estimate that disruptions of 1.0 million barrels per day, equivalent to about half of Iran’s exports, sustained over 12 months could add roughly $8.0 to oil prices.
Meanwhile, today at 17:30 (GMT+2), market participants will analyze the final US Energy Information Administration (EIA) report on inventories. Previously, a sharp drawdown of 9.014 million barrels was recorded, providing notable support to bullish sentiment. However, similar data from the American Petroleum Institute (API) released earlier showed inventories rising from –0.609 million barrels to 11.400 million barrels, which also acted as a driver for a downward price correction.
Support and Resistance Levels
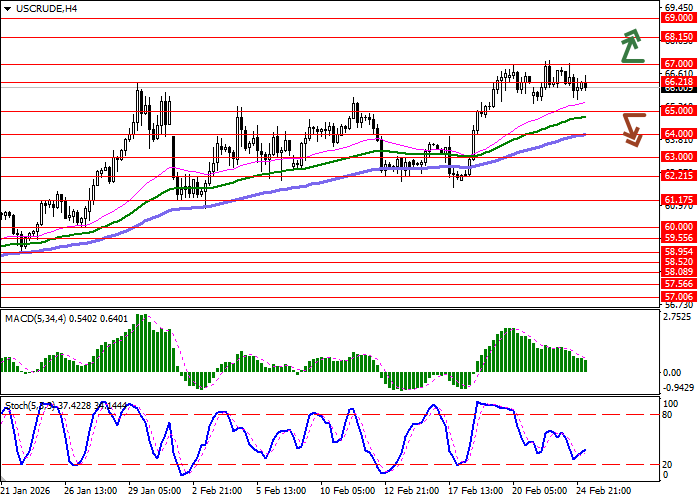
On the daily chart, Bollinger Bands show confident upward movement as the price range expands, opening the way for bulls toward new local highs. At the same time, MACD is turning lower and preparing to form a new sell signal, with the histogram attempting to move below the signal line. The Stochastic oscillator shows a similar dynamic, retreating relatively quickly from overbought levels and signaling increased risks of a near-term correction.
Resistance levels: 66.21, 67.00, 68.15, 69.00.
Support levels: 65.00, 64.00, 63.00, 62.21.
Trading Scenarios and WTI Crude Oil Forecast
Short positions may be considered after a confident break below 65.00, targeting 63.00. Stop-loss — 66.21. Time horizon: 2–3 days.
A return of bullish momentum followed by a breakout above 67.00 may signal opportunities to open long positions with a target at 69.00. Stop-loss — 66.00.
Scenario
| Timeframe | Intraday |
| Recommendation | SELL STOP |
| Entry point | 64.95 |
| Take Profit | 63.00 |
| Stop Loss | 66.21 |
| Key levels | 62.21, 63.00, 64.00, 65.00, 66.21, 67.00, 68.15, 69.00 |
Alternative Scenario
| Recommendation | BUY STOP |
| Entry point | 67.05 |
| Take Profit | 69.00 |
| Stop Loss | 66.00 |
| Key levels | 62.21, 63.00, 64.00, 65.00, 66.21, 67.00, 68.15, 69.00 |
