
Management has announced plans to enter the graphics processing unit (GPU) market, which is currently dominated by Nvidia Corp. with a market share exceeding 80.0% in the artificial intelligence (AI) and data center accelerator segment as of 2025. To implement this strategy, Intel plans to invest at least $10.0 billion in the development of its own GPU architecture between 2026 and 2030, aiming to capture 10.0–15.0% of the market by 2028.
As part of this initiative, the company has already recruited Eric Demers, who previously worked on Radeon processors at Advanced Micro Devices Inc. and has more than 20 years of experience in graphics and parallel computing system development. This move is considered a key step in strengthening Intel’s engineering team, which includes over 1,000 hardware and software specialists. At the same time, the corporation is expanding cooperation with Saimemory Corp., a contractor of SoftBank Corp., on next-generation Z Angle Memory (ZAM) technologies. According to official statements, ZAM could significantly increase memory bandwidth compared to DDR5 while reducing power consumption by 30.0%.
Against this backdrop, analysts at D.A. Davidson & Co. have revised their outlook on the company’s shares, maintaining a “neutral” rating with a target price of $45.00 per share. Experts note that Intel Corp. still faces major challenges in its efforts to restore its market positions.
The company’s first-quarter financial report is scheduled for release on April 23. According to forecasts, earnings per share (EPS) are expected to come in at just $0.01, compared with $0.15 in the previous quarter and $0.13 a year earlier, while revenue is projected at $12.30 billion versus $13.70 billion and $12.67 billion, respectively. Intel does not currently plan to resume dividend payments, which were suspended in September 2024.
Support and Resistance Levels
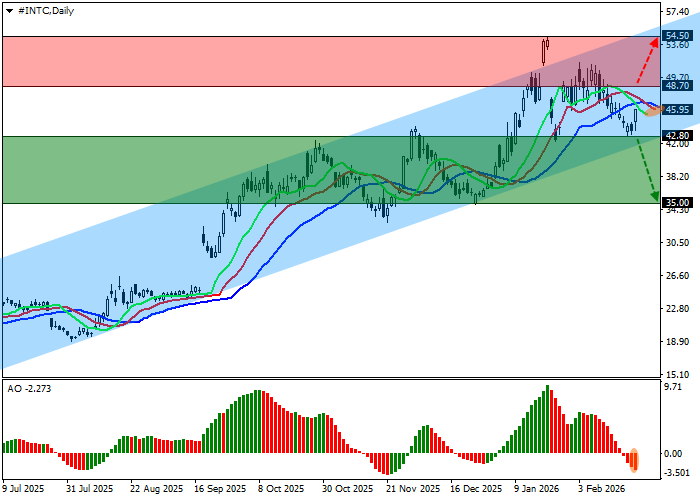
On the daily chart, the price is hovering near the support line of an ascending channel with dynamic boundaries at 55.00–42.00, signaling readiness for a potential continuation of the decline.
Technical indicators are generating a sell signal: the EMA range of the Alligator indicator is trending downward, while the AO histogram is forming corrective bars slightly below the zero line.
Resistance levels: 48.70, 54.50.
Support levels: 42.80, 35.00.
Trading Scenarios and Intel Price Forecast
Short positions can be opened after the price declines and consolidates below 42.80, with a target at 35.00 and a stop-loss at 46.00. Time horizon: 7 days or more.
Long positions can be opened after the price rises and consolidates above 48.70, with a target at 54.50. Stop-loss — 46.00.
Scenario
| Timeframe | Weekly |
| Recommendation | SELL STOP |
| Entry Point | 42.75 |
| Take Profit | 35.00 |
| Stop Loss | 46.00 |
| Key Levels | 35.00, 42.80, 48.70, 54.50 |
Alternative Scenario
| Recommendation | BUY STOP |
| Entry Point | 48.75 |
| Take Profit | 54.50 |
| Stop Loss | 46.00 |
| Key Levels | 35.00, 42.80, 48.70, 54.50 |
