
According to Nikkei, the recent bank-led alignment of U.S. dollar and Japanese yen exchange rates, which drove the pair higher, was initiated by U.S. Treasury Secretary Scott Bessent. The move was reportedly prompted by uncertainty in Japan ahead of the general election, which could negatively affect the economies of both countries. Through this action, the White House signaled its readiness to support the yen in order to prevent excessive weakening below certain levels. While the measures proved fairly effective, their impact is gradually fading, increasing market tension as investors now expect similar steps—or even a full-scale intervention—from both Washington and Tokyo.
The U.S. dollar maintains the positive momentum from last week, holding near 97.60 in the USDX, while traders focus on the Republican administration’s trade policy. In response to a U.S. Supreme Court ruling that declared last year’s global import tariffs unlawful and noted that President Donald Trump exceeded his authority by invoking the International Emergency Economic Powers Act (IEEPA) without congressional approval, the president announced the introduction of a universal 15.0% tariff on imports from all countries under the Trade Act of 1974. As a result, several trading partners have suspended negotiations with the United States pending further clarification. Given that total U.S. imports exceed $3.0 trillion annually, even partial shifts in trade flows could affect the trade balance and inflation expectations. Meanwhile, Automatic Data Processing (ADP) reported that nonfarm private-sector job creation rose to 12.8K from 11.5K previously, while the Conference Board’s Consumer Confidence Index increased from 89.0 to 91.2 points, providing additional support to the U.S. dollar.
Support and Resistance Levels
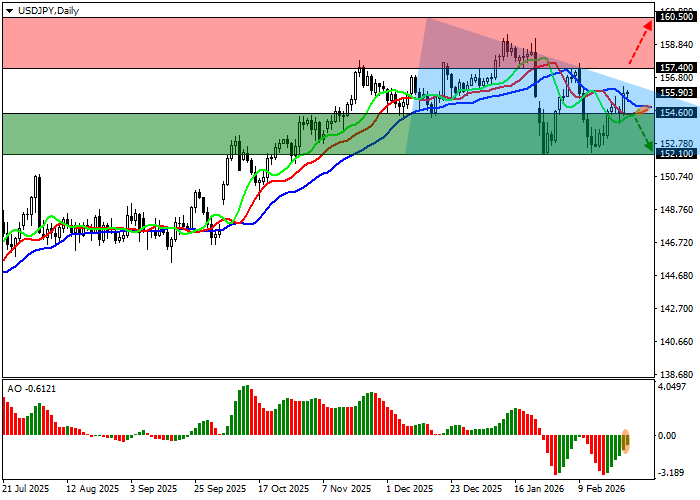
On the daily chart, the instrument is attempting to consolidate near the resistance line of the “triangle” pattern, with boundaries at 156.00–152.00.
Technical indicators are weakening the sell signal: the fast EMAs of the Alligator indicator are approaching the signal line, while the AO histogram is forming corrective bars below the zero line.
Resistance levels: 157.40, 160.50.
Support levels: 154.60, 152.10.
Trading Scenarios and USD/JPY Forecast
Short positions can be opened after a decline and consolidation below the 154.60 level, with a target at 152.10. Stop loss — 155.50. Time horizon: 7 days or more.
Long positions can be opened after a rise and consolidation above the 157.40 level, with a target at 160.50. Stop loss — 156.30.
Scenario
| Timeframe | Weekly |
| Recommendation | SELL STOP |
| Entry Point | 154.55 |
| Take Profit | 152.10 |
| Stop Loss | 155.50 |
| Key Levels | 152.10, 154.60, 157.40, 160.50 |
Alternative Scenario
| Recommendation | BUY STOP |
| Entry Point | 157.45 |
| Take Profit | 160.50 |
| Stop Loss | 156.30 |
| Key Levels | 152.10, 154.60, 157.40, 160.50 |
