

At the start of the year, management announced plans to launch two artificial intelligence (AI)–based digital solutions aimed at optimizing and accelerating engineering design processes for corporate clients. These include the Ask M3 digital assistant, designed to support engineers and developers in identifying optimal design solutions by leveraging 3M Co.’s extensive portfolio of industrial materials and tapes, machine-learning–based analytical models, and an expanded version of the Digital Materials Hub software platform. The upgraded service, first introduced in early 2025, now offers enhanced functionality and includes models capable of assessing the properties and behavior of optical films within standard computer-aided simulation environments. Analysts note that these new products should improve the company’s operational efficiency and strengthen its technological edge.
As for financial performance, fourth-quarter revenue is expected to reach $6.02 billion, slightly below $6.30 billion in the previous quarter but above $6.01 billion recorded a year earlier. Earnings per share are projected at around $1.81, compared with $2.19 in the prior period and $1.68 a year ago.
Regarding dividends, shareholders received $0.73 per share on December 12, corresponding to a yield of 1.71%. The next payout has not yet been announced, but it is likely to amount to an indexed $0.79–$0.83, somewhat below the sector median yield of 2.26%.
Support and resistance levels
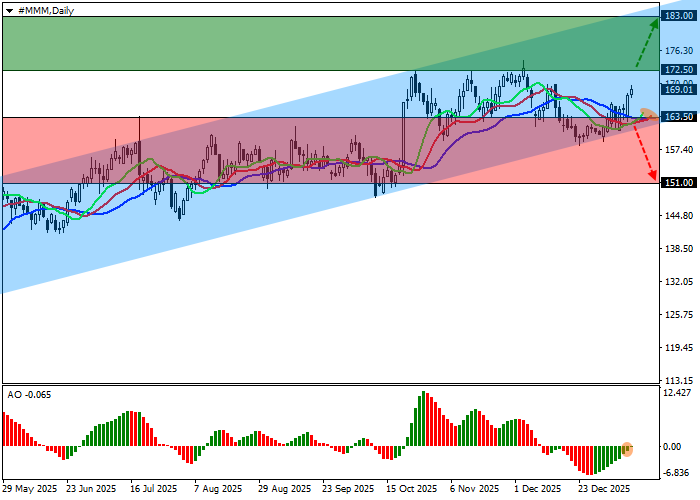
On the daily chart, the instrument is forming an ascending channel with dynamic boundaries at 185.00–163.00.
Technical indicators are reinforcing the buy signal following the completion of the correction: the Awesome Oscillator histogram is forming new corrective bars, while the fast EMAs of the Alligator indicator continue to diverge from the signal line.
Support levels: 163.50, 151.00.
Resistance levels: 172.50, 183.00.
Trading scenarios and 3M share price outlook
Long positions may be opened after a sustained move above 172.50, with targets at 183.00 and a stop-loss at 169.00. Time horizon: 7 days or longer.
Short positions may be opened after a sustained move below 163.50, with a target at 151.00. Stop-loss at 168.00.
Scenario
| Timeframe | Weekly |
| Recommendation | BUY STOP |
| Entry point | 172.55 |
| Take Profit | 183.00 |
| Stop Loss | 169.00 |
| Key levels | 151.00, 163.50, 172.50, 183.00 |
Alternative scenario
| Recommendation | SELL STOP |
| Entry point | 163.45 |
| Take Profit | 151.00 |
| Stop Loss | 168.00 |
| Key levels | 151.00, 163.50, 172.50, 183.00 |
