

The initial pullback followed reports of renewed diplomatic efforts to resolve the US-Iran conflict. On Monday, October 26, representatives of Saudi Arabia, Turkey and Pakistan held talks with senior Iranian officials in Tehran. Saudi Arabia's foreign ministry said in its statement on the visit that the discussions were intended to ease tensions and support a diplomatic solution. Separately, Iranian state media reported that Supreme Leader Mojtaba Khamenei had stressed the need to secure Iran's conditions for ending the conflict and the prolonged state of uncertainty. These developments eased some concerns about a further escalation of supply disruptions and weighed on oil prices, although no settlement was announced.
Supply concerns subsequently returned after Yemen's Houthis said they had struck Saudi Arabia's Ras Tanura refinery with a ballistic missile. The refinery has a processing capacity of 550,000 barrels per day and is located near a major Saudi crude export terminal. However, the claim that the refinery was hit had not been independently confirmed, and the extent of any disruption remained unclear. The incident nevertheless highlighted the vulnerability of regional energy infrastructure, a risk also discussed in our previous Brent crude oil forecast. Meanwhile, US President Donald Trump continued to leave open the choice between ending the conflict quickly and maintaining pressure on Iran, underscoring uncertainty over Washington's next steps.
A further decline in US crude inventories is also supporting prices. Figures attributed to the American Petroleum Institute (API) showed a draw of 2.031 million barrels in the week ended October 23, the fourth consecutive weekly decline. Against this backdrop, Brent recovered its earlier losses and returned to the 112.00 area. Further gains could nevertheless be constrained by concerns about weaker demand: sustained prices in the 110.00–130.00 range could squeeze business margins and encourage companies to reduce energy consumption.
Support and Resistance Levels
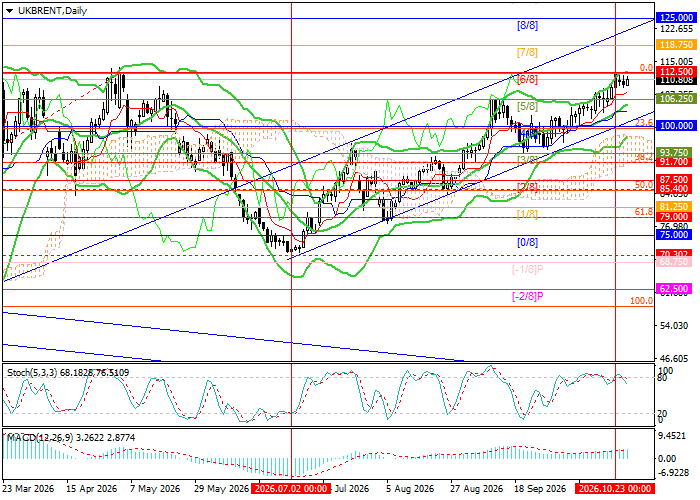
The instrument is approaching 112.50 (Murray level [6/8], 0.0% Fibonacci retracement). A sustained move above this level could open the way towards 118.75 (Murray level [7/8]) and 125.00 (Murray level [8/8]). Conversely, a break below the lower Bollinger Band at 100.00 (Murray level [4/8], 23.6% Fibonacci retracement) could take prices out of their ascending range and expose 91.70 (38.2% Fibonacci retracement) and 85.40 (50.0% Fibonacci retracement).
Technical indicators offer mixed signals: Bollinger Bands are turning higher and the MACD histogram remains stable in positive territory, but the Stochastic oscillator is leaving overbought territory, leaving room for a limited pullback.
Resistance levels: 112.50, 118.75, 125.00.
Support levels: 100.00, 91.70, 85.40.
Trading Scenarios and Brent Crude Oil Forecast
Long positions may be considered from 113.50, targeting 118.75 and 125.00, with a Stop Loss at 110.50. Expected holding period: 5–7 days.
Short positions may be considered below 100.00, targeting 91.70 and 85.40, with a Stop Loss at 103.80.
Primary Scenario
| Timeframe | Weekly |
| Recommendation | BUY STOP |
| Entry Point | 113.50 |
| Take Profit | 118.75, 125.00 |
| Stop Loss | 110.50 |
| Key Levels | 85.40, 91.70, 100.00, 112.50, 118.75, 125.00 |
Alternative Scenario
| Recommendation | SELL STOP |
| Entry Point | 100.00 |
| Take Profit | 91.70, 85.40 |
| Stop Loss | 103.80 |
| Key Levels | 85.40, 91.70, 100.00, 112.50, 118.75, 125.00 |
