

The company's second-quarter 2026 results showed net revenue of $9.3 billion, up 14% year on year, or 12% on a currency-neutral basis. Adjusted diluted earnings per share rose 21% to $5.04, while cross-border payment volume increased 12% in local currency terms. These results provide the financial backdrop ahead of the company's third-quarter earnings, scheduled for October 29.
On the daily chart, the price remains below the resistance line of a broader ascending channel with dynamic boundaries at 570.00 and 650.00, leaving room for further gains. The stock has recovered from the lower levels discussed in our previous Mastercard forecast.
On the four-hour chart, the price is holding above the previous swing high at 600.00, supporting the prospect of further gains. If this level holds, the stock could advance towards the broader channel's resistance near 645.00.
Technical indicators could strengthen the buy signal generated earlier this month: the Alligator indicator's faster moving averages remain above its slower lines, maintaining a stable spread, while the Awesome Oscillator (AO) histogram is forming corrective bars in positive territory.
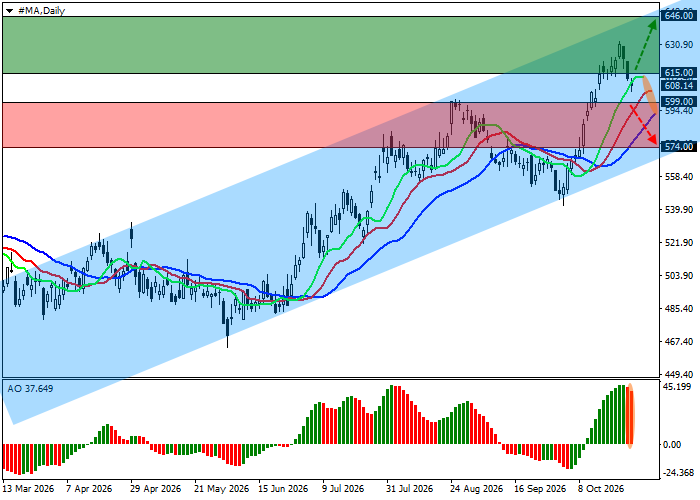
Trading Scenarios and Mastercard Stock Forecast
Long positions may be considered after the price breaks and holds above 615.00, targeting 646.00. Stop Loss: 605.00. Expected holding period: 7 days or longer.
Short positions may be considered after the price breaks and holds below 599.00, targeting 574.00. Stop Loss: 612.00.
Primary Scenario
| Timeframe | Weekly |
| Recommendation | BUY STOP |
| Entry Point | 615.00 |
| Take Profit | 646.00 |
| Stop Loss | 605.00 |
| Key Levels | 574.00, 599.00, 615.00, 646.00 |
Alternative Scenario
| Recommendation | SELL STOP |
| Entry Point | 599.00 |
| Take Profit | 574.00 |
| Stop Loss | 612.00 |
| Key Levels | 574.00, 599.00, 615.00, 646.00 |
