

Geopolitical tensions in the Persian Gulf remain a major focus for investors. Reports of incidents involving tankers in the Strait of Hormuz and Houthi attacks on Saudi Arabian targets continue to raise concerns about energy supplies, keeping oil prices elevated above $100.00 a barrel. Although geopolitical uncertainty can support safe-haven demand for gold, higher energy prices also increase inflation risks and could encourage the Federal Reserve to keep interest rates higher for longer. Expectations of a pause at the October meeting therefore offer limited reassurance to gold buyers if further tightening remains possible later in the year. A stronger US dollar and elevated Treasury yields can weigh on the metal by making it more expensive for holders of other currencies and increasing the opportunity cost of holding a non-yielding asset. These competing pressures were also discussed in our previous XAU/USD forecast. Lower oil prices and falling Treasury yields could ease some of these headwinds, although neither is a prerequisite for a recovery in gold.
Speculative positioning has also become less bullish. According to the US Commodity Futures Trading Commission's Commitments of Traders report, large non-commercial traders held a net long position of 199,865 COMEX gold futures contracts as of October 20, down from 207,879 a week earlier. Their long positions declined by 8,158 contracts, while short positions fell by 144, producing a net reduction of 8,014 contracts. This indicates a smaller bullish exposure among large speculators, rather than a decline in all gold positions: total open interest increased by 5,934 contracts to 402,279 over the same period.
Support and Resistance Levels
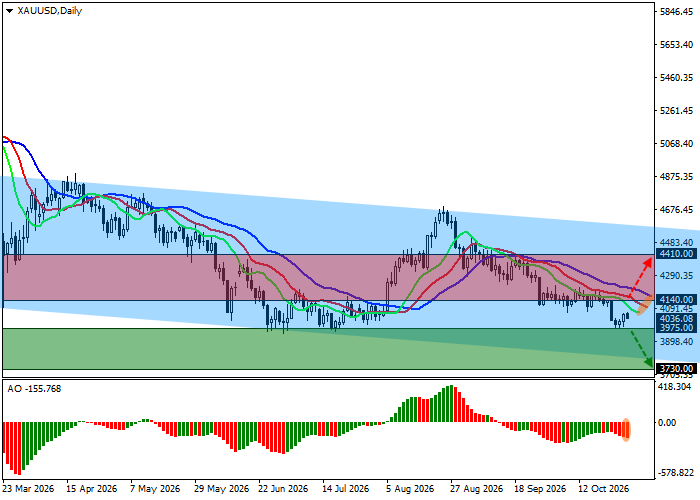
On the daily chart, the instrument is correcting well below the resistance line of a broader descending channel with dynamic boundaries at 3800.0 and 4500.0.
Technical indicators are strengthening their sell signal: the Alligator indicator's faster moving averages remain below its slower lines, while the Awesome Oscillator (AO) histogram is forming corrective bars in negative territory.
Support levels: 3975.0, 3730.0.
Resistance levels: 4140.0, 4410.0.
Trading Scenarios and XAU/USD Forecast
Short positions may be considered after the price breaks and holds below 3975.0, targeting 3730.0. Stop Loss: 4100.0. Expected holding period: 7 days or longer.
Long positions may be considered after the price breaks and holds above 4140.0, targeting 4410.0. Stop Loss: 4020.0.
Primary Scenario
| Timeframe | Weekly |
| Recommendation | SELL STOP |
| Entry Point | 3975.0 |
| Take Profit | 3730.0 |
| Stop Loss | 4100.0 |
| Key Levels | 3730.0, 3975.0, 4140.0, 4410.0 |
Alternative Scenario
| Recommendation | BUY STOP |
| Entry Point | 4140.0 |
| Take Profit | 4410.0 |
| Stop Loss | 4020.0 |
| Key Levels | 3730.0, 3975.0, 4140.0, 4410.0 |
