

The index remains in a downward correction as tensions persist in the Persian Gulf, while widespread protests in France continue to disrupt economic activity. On October 23, Moody's Ratings concluded its review of France's creditworthiness and, contrary to some analysts' expectations, left its sovereign rating unchanged at Aa3 with a negative outlook. France's finance ministry described the decision as recognition of the credibility of the government's proposed 2027 budget. However, the negative outlook leaves the risk of a future downgrade in place if fiscal consolidation falls short. These political and debt risks were also discussed in our previous analysis of French debt pressures and the euro.
Meanwhile, corporate earnings remain in focus. In its third-quarter results released on October 27, Orange SA reported revenue of €12.2 billion, up 3.6% year on year on a comparable basis. EBITDAaL increased by 4.6% to €4.1 billion, prompting the group to raise its full-year EBITDAaL growth target to more than 4.5%. Separately, France held its latest short-term Treasury bill auctions on the afternoon of October 26. The weighted average yield on the approximately three-month issue was 2.787%, compared with 2.750% at the previous auction. Two approximately six-month issues yielded 3.025% and 3.104%, with the latter comparing with 3.045% at its previous placement. The approximately one-year issue yielded 3.365%, up from 3.292%. In the market snapshot, 10-year government bond yields stood at 4.907%, versus 5.084% late last week; 20-year yields were 5.266%, versus 5.426%; and 30-year yields were 5.405%, versus 5.543%.
The leading gainers in the session snapshot were Stellantis NV (+3.91%), Hermès International SCA (+3.23%), STMicroelectronics NV (+2.61%), BNP Paribas SA (+2.43%) and Eiffage SA (+2.34%).
The largest declines in the same snapshot were recorded by EssilorLuxottica SA (–3.42%), Publicis Groupe SA (–1.58%), ArcelorMittal SA (–0.90%), Euronext (–0.45%) and Carrefour SA (–0.43%).
Support and Resistance Levels
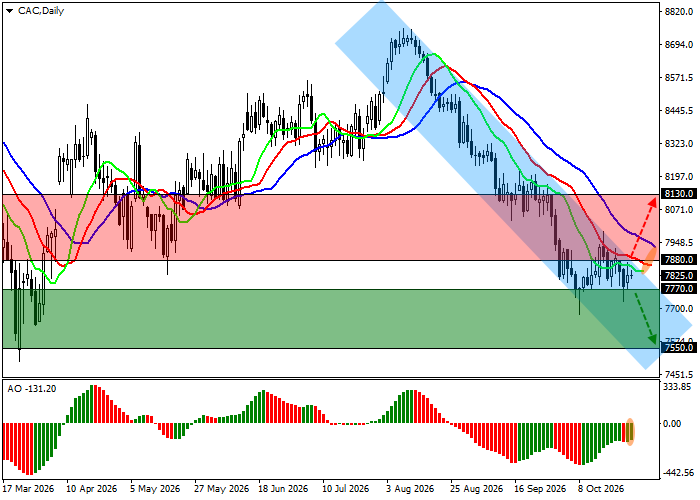
On the daily chart, the index continues its local correction while remaining above the support line of a broader descending channel with dynamic boundaries at 7770.0 and 7900.0.
Technical indicators are strengthening their sell signal: the Alligator indicator's faster moving averages are widening their range, while the Awesome Oscillator (AO) histogram is forming corrective bars in negative territory.
Support levels: 7770.0, 7550.0.
Resistance levels: 7880.0, 8130.0.
Trading Scenarios and CAC 40 Forecast
Short positions may be considered after the index breaks and holds below 7770.0, targeting 7550.0. Stop Loss: 7850.0. Expected holding period: 7 days or longer.
Long positions may be considered after the index breaks and holds above 7880.0, targeting 8130.0, with a Stop Loss at 7800.0.
Primary Scenario
| Timeframe | Weekly |
| Recommendation | SELL STOP |
| Entry Point | 7770.0 |
| Take Profit | 7550.0 |
| Stop Loss | 7850.0 |
| Key Levels | 7550.0, 7770.0, 7880.0, 8130.0 |
Alternative Scenario
| Recommendation | BUY STOP |
| Entry Point | 7880.0 |
| Take Profit | 8130.0 |
| Stop Loss | 7800.0 |
| Key Levels | 7550.0, 7770.0, 7880.0, 8130.0 |
