

US Secretary of State Marco Rubio said on October 31 that President Donald Trump would prefer to resolve the conflict with Iran diplomatically, while leaving military options open. Vice President JD Vance subsequently expressed cautious optimism about the prospects for a negotiated settlement, although no agreement was announced. These comments eased some concerns about a further deterioration in regional energy supplies. With the November 3 US congressional elections now over, traders are assessing how the results could affect Washington’s foreign policy, but a change in the composition of Congress does not itself guarantee a settlement. The competing effects of diplomacy and supply risks were also discussed in our previous Brent crude oil forecast.
Nevertheless, persistent supply risks could continue to support prices over the medium term. On November 4, Iran’s Islamic Revolutionary Guard Corps claimed that four tankers had struck naval mines while attempting to use a route it described as prohibited near the Strait of Hormuz. These statements should be treated as claims rather than independently established losses. Uncertainty surrounding shipping through the region continues to support a risk premium. US inventory data also offered support: published figures attributed to the American Petroleum Institute’s Weekly Statistical Bulletin, released on November 3, showed a 5.267 million-barrel decline in crude stocks for the week ended October 30, compared with expectations of a 2.100 million-barrel increase. This marked the fifth consecutive weekly draw.
Overall, a recovery remains possible if supply concerns persist, although further diplomatic progress could place renewed downward pressure on prices.
Support and Resistance Levels
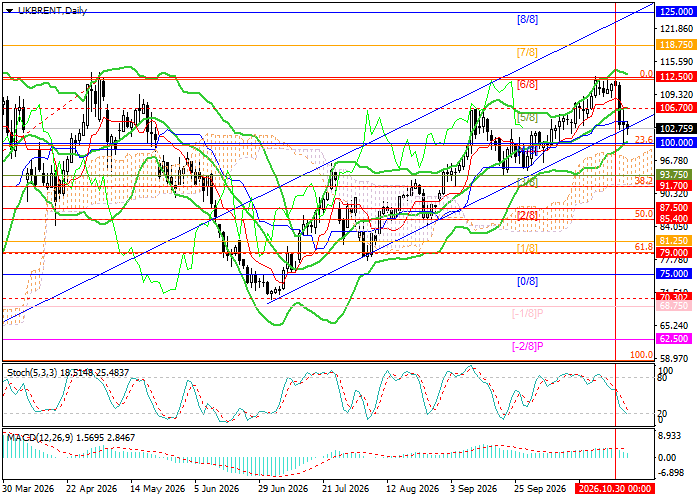
In the supplied technical setup, the instrument has tested the lower boundary of the ascending channel near 102.50. A break below 100.00 (Murrey Math [4/8], 23.6% Fibonacci retracement) could open the way toward 91.70 (38.2% Fibonacci retracement) and 85.40 (50.0% Fibonacci retracement). Conversely, a recovery above the middle Bollinger Band at 106.70 could bring 112.50 (Murrey Math [6/8], 0.0% Fibonacci retracement), 118.75 (Murrey Math [7/8]) and 125.00 (Murrey Math [8/8]) into focus.
Technical indicators retain a bullish bias, although momentum has weakened: Bollinger Bands are turning upward, the MACD histogram is contracting in positive territory, and the Stochastic oscillator has reached the oversold zone, where an upward reversal remains possible.
Resistance levels: 106.70, 112.50, 118.75, 125.00.
Support levels: 100.00, 91.70, 85.40.
Brent Crude Oil Trading Scenarios and Price Forecast
Long positions may be opened above 106.70, with targets at 112.50, 118.75 and 125.00 and a stop-loss at 103.00. Estimated holding period: 5–7 days.
Short positions may be opened below 100.00, with targets at 91.70 and 85.40 and a stop-loss at 103.80.
Scenario
| Timeframe | Weekly |
| Recommendation | BUY STOP |
| Entry Point | 106.70 |
| Take Profit | 112.50, 118.75, 125.00 |
| Stop Loss | 103.00 |
| Key Levels | 85.40, 91.70, 100.00, 106.70, 112.50, 118.75, 125.00 |
Alternative Scenario
| Recommendation | SELL STOP |
| Entry Point | 100.00 |
| Take Profit | 91.70, 85.40 |
| Stop Loss | 103.80 |
| Key Levels | 85.40, 91.70, 100.00, 106.70, 112.50, 118.75, 125.00 |
