

According to the Australian Bureau of Statistics’ September CPI report, annual headline inflation accelerated from 4.0% to 4.3%, while trimmed mean inflation increased from a revised 3.5% to 3.6%. The weighted median measure stood at 3.4%. These readings remained above the Reserve Bank of Australia’s (RBA) 2.0–3.0% target range, reinforcing expectations of further monetary tightening. Following the release, published market estimates placed the probability of a quarter-point increase at the November 3 meeting at approximately 85–90%. Such a move would represent the fifth rate increase this year. The inflation figures initially supported the Australian dollar, although the pair subsequently retreated as investors assessed the US policy outlook.
The Federal Reserve maintained its federal funds target range at 3.75–4.00% on October 28, stating that additional information would help policymakers determine the stance needed to return inflation to the 2.0% target. The September personal consumption expenditures (PCE) report, released on October 29, subsequently showed annual headline inflation of 3.6%, compared with 3.4% in August, while core inflation stood at 3.1%. On a monthly basis, headline and core PCE prices increased by 0.5% and 0.3%, respectively. Persistent inflation keeps the possibility of further tightening in focus, although a December rate increase remains dependent on incoming data.
Overall, the outlook remains uncertain, with medium-term price movements likely to depend heavily on new monetary policy signals from the Federal Reserve and the RBA. The role of Australian economic data in shaping policy expectations was also discussed in our previous AUD/USD forecast.
Support and Resistance Levels
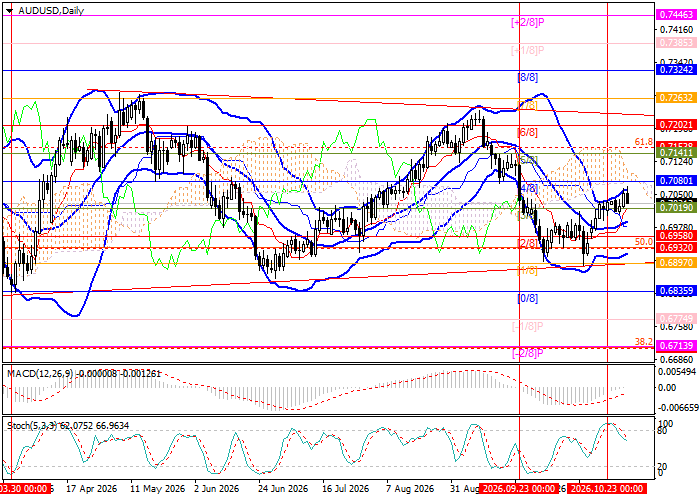
The supplied chart analysis identifies a symmetrical triangle, leaving the pair vulnerable to a breakout in either direction. Resistance at 0.7080 (Murrey Math [4/8]) remains the key upside threshold: a break above it could open the way toward 0.7202 (Murrey Math [6/8]) and 0.7324 (Murrey Math [8/8]). Conversely, a break below 0.6932 (50.0% Fibonacci retracement) could trigger renewed declines toward 0.6835 (Murrey Math [0/8]) and 0.6713 (38.2% Fibonacci retracement, Murrey Math [–2/8]).
Technical indicators provide mixed signals: Bollinger Bands are turning upward, the MACD histogram is approaching positive territory, while the Stochastic oscillator has turned downward from the overbought zone.
Resistance levels: 0.7080, 0.7202, 0.7324.
Support levels: 0.6932, 0.6835, 0.6713.
AUD/USD Trading Scenarios and Exchange Rate Forecast
Long positions may be opened above 0.7080, with targets at 0.7202 and 0.7324 and a stop-loss at 0.6990. Estimated holding period: 5–7 days.
Short positions may be opened below 0.6932, with targets at 0.6835 and 0.6713 and a stop-loss at 0.7000.
Scenario
| Timeframe | Weekly |
| Recommendation | BUY STOP |
| Entry Point | 0.7080 |
| Take Profit | 0.7202, 0.7324 |
| Stop Loss | 0.6990 |
| Key Levels | 0.6713, 0.6835, 0.6932, 0.7080, 0.7202, 0.7324 |
Alternative Scenario
| Recommendation | SELL STOP |
| Entry Point | 0.6932 |
| Take Profit | 0.6835, 0.6713 |
| Stop Loss | 0.7000 |
| Key Levels | 0.6713, 0.6835, 0.6932, 0.7080, 0.7202, 0.7324 |
