

Geopolitical developments in the Persian Gulf remain an important influence on sentiment, with reports of incidents involving tankers near the Strait of Hormuz keeping shipping risks in focus. At the same time, diplomatic signals have raised hopes for a negotiated resolution to the conflict. The implications for gold are mixed: progress toward an agreement could reduce demand for safe-haven assets, while a weaker US dollar could support dollar-denominated bullion. The interaction between geopolitical uncertainty and interest rate expectations was also discussed in our previous gold price forecast.
Speculative positioning has weakened. Calculations from the CFTC’s October 27 Commitments of Traders report show that non-commercial traders held a net long position of 186,451 standard COMEX gold futures contracts, down from 199,865 a week earlier. This reflects a smaller bullish position rather than a measure of daily trading volume. Relative performance against silver is also relevant: a gold-to-silver ratio of approximately 78 means that one troy ounce of gold is worth around 78 ounces of silver. A rising ratio indicates that gold is outperforming silver, including when both metals decline but silver falls faster. The ratio can subsequently narrow through stronger silver prices, weaker gold prices or a combination of both. Its level therefore provides context for relative valuations rather than a reliable signal of an imminent rise in XAU/USD.
Support and Resistance Levels
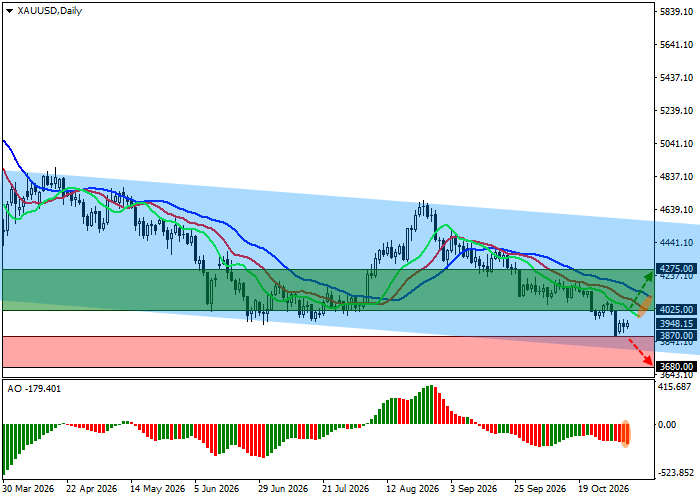
On the daily chart, the instrument is trading in the lower part of a broader descending channel with dynamic boundaries at approximately 4500.0–3830.0.
Technical indicators maintain a sell signal: the fast exponential moving averages (EMAs) of the Alligator indicator remain below the slow ones, while the Awesome Oscillator (AO) histogram is forming corrective bars in negative territory.
Support levels: 3870.0, 3680.0.
Resistance levels: 4025.0, 4275.0.
XAU/USD Trading Scenarios and Gold Price Forecast
Long positions may be opened after the price rises and consolidates above 4025.0, with a target at 4275.0. Stop-loss: 3950.0. Estimated holding period: 7 days or more.
Short positions may be opened after the price declines and consolidates below 3870.0, with a target at 3680.0. Stop-loss: 4000.0.
Scenario
| Timeframe | Weekly |
| Recommendation | BUY STOP |
| Entry Point | 4025.0 |
| Take Profit | 4275.0 |
| Stop Loss | 3950.0 |
| Key Levels | 3680.0, 3870.0, 4025.0, 4275.0 |
Alternative Scenario
| Recommendation | SELL STOP |
| Entry Point | 3870.0 |
| Take Profit | 3680.0 |
| Stop Loss | 4000.0 |
| Key Levels | 3680.0, 3870.0, 4025.0, 4275.0 |
