

Corporate earnings remain an important focus for investors. On November 4, Mitsubishi Corporation, Mitsui & Co. and IHI Corporation published results for the six months ended September 30, 2026. According to Mitsubishi’s financial report, revenue increased by 20.5% year-on-year to ¥10.410 trillion, while basic earnings per share (EPS) reached ¥169.21, compared with ¥91.87 a year earlier. Mitsui reported revenue of ¥8.322 trillion, up 23.1%, and basic EPS of ¥202.88, compared with ¥147.41. IHI’s revenue rose by 9.2% to ¥779.318 billion, while basic EPS increased to ¥80.17 from ¥52.76. These are cumulative six-month results rather than standalone quarterly figures.
Japanese government bond yields eased in the original market snapshot. The 10-year yield stood at 2.801%, compared with 2.841% a week earlier. The 20-year yield declined to 3.643% from 3.678%, while the 30-year yield eased to 3.898% from 3.918%. Lower yields can influence equity valuations, although the figures alone do not establish a shift of capital from bonds into shares. The broader market backdrop was also discussed in our previous Nikkei 225 forecast.
Among the gainers in the supplied intraday snapshot were Yamato Holdings Co. Ltd. (+11.36%), Yamaha Corp. (+4.09%), Japan Airlines Co. Ltd. (+3.86%), Central Japan Railway Co. (+3.52%) and Toho Co. Ltd. (+3.14%).
Decliners included Taiyo Yuden Co. Ltd. (–12.13%), Mitsui Chemicals Inc. (–11.88%), Kioxia Holdings Corp. (–10.40%), Mitsui Mining and Smelting Co. (–9.95%) and Furukawa Electric Co. Ltd. (–9.89%).
Support and Resistance Levels
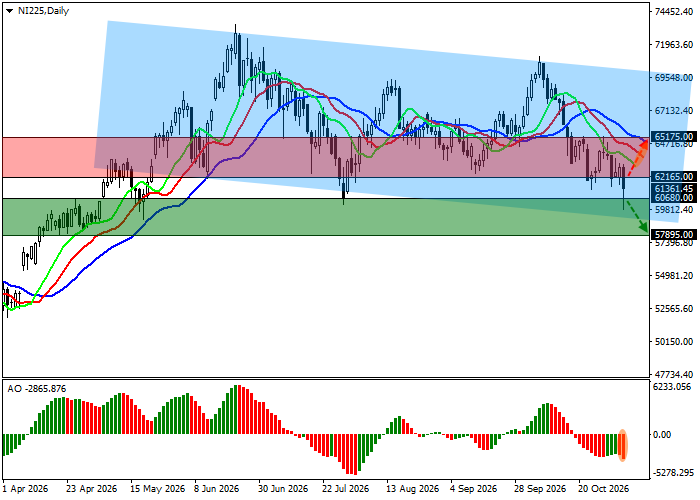
On the daily chart, the index continues to move lower within a local descending channel with dynamic boundaries at approximately 69600.0–58000.0.
Technical indicators maintain a sell signal: the Awesome Oscillator (AO) histogram is forming corrective bars, while the fast exponential moving averages (EMAs) of the Alligator indicator are declining below the slow ones, with the spread gradually widening.
Support levels: 60680.0, 57895.0.
Resistance levels: 62165.0, 65175.0.
Nikkei 225 Trading Scenarios and Index Forecast
Short positions may be opened after the price declines and consolidates below 60680.0, with a target at 57895.0. Stop-loss: 61200.0. Estimated holding period: 7 days or more.
Long positions may be opened after the price rises and consolidates above 62165.0, with a target at 65175.0. Stop-loss: 61000.0.
Scenario
| Timeframe | Weekly |
| Recommendation | SELL STOP |
| Entry Point | 60680.0 |
| Take Profit | 57895.0 |
| Stop Loss | 61200.0 |
| Key Levels | 57895.0, 60680.0, 62165.0, 65175.0 |
Alternative Scenario
| Recommendation | BUY STOP |
| Entry Point | 62165.0 |
| Take Profit | 65175.0 |
| Stop Loss | 61000.0 |
| Key Levels | 57895.0, 60680.0, 62165.0, 65175.0 |
