

Markets are weighing reports of possible new US–Iran peace talks against the risk of renewed fighting in the Middle East. Analysts believe the Democratic victory in the congressional elections could increase pressure on President Donald Trump to seek a settlement, although the substantial US military presence in the region leaves further action possible. On November 8, Trump said fresh strikes were highly unlikely if negotiations made progress, while keeping the military option open. This uncertainty continues to draw investors towards safe-haven assets and can support precious metal prices. The influence of geopolitical developments on gold was also discussed in our previous gold price forecast.
The gold-to-silver ratio remains an important relative-value measure. It traded around 40:1–60:1 earlier in the year and is now approximately 77:1. The wider ratio may encourage investors to consider adding silver exposure alongside existing gold holdings in anticipation of silver outperforming gold. Against the backdrop of recent dollar strength, trading activity remains uneven, while net speculative positioning has declined over four consecutive weeks. The CFTC report covering November 3 showed non-commercial net long positions of 179.5 thousand contracts, down from 186.5 thousand a week earlier. Separately, CME Group recorded trading volume of 221.8 thousand gold futures contracts and approximately 67.0 thousand gold options contracts, including weekly series, on November 6. These compare with October daily averages cited at 178.0 thousand and 52.0 thousand, respectively.
Support and Resistance Levels
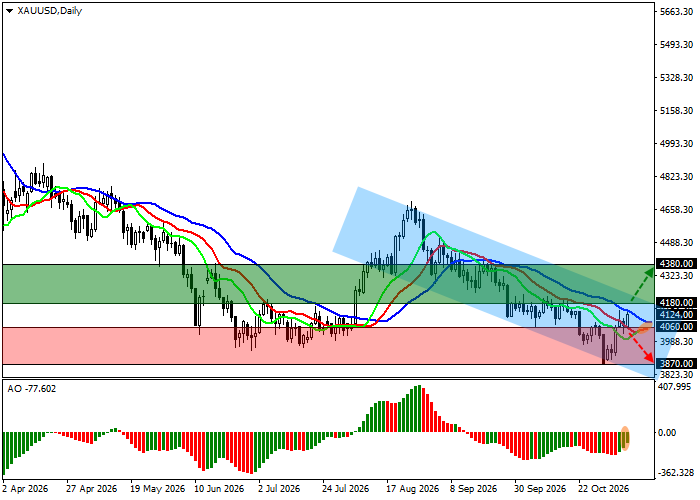
On the daily chart, the instrument is trading near the resistance line of a broader descending channel with dynamic boundaries at 4200.0–3800.0.
Technical indicators suggest that the sell signal is weakening. The Alligator indicator's faster exponential moving averages (EMAs) remain below the slower ones, while the Awesome Oscillator (AO) histogram is forming corrective bars in negative territory.
Support levels: 4060.0, 3870.0.
Resistance levels: 4180.0, 4380.0.
XAU/USD Trading Scenarios and Gold Price Forecast
Long positions may be considered after the price rises and consolidates above 4180.0, targeting 4380.0 with a stop-loss at 4100.0. The estimated holding period is seven days or more.
Short positions may be considered after the price declines and consolidates below 4060.0, targeting 3870.0 with a stop-loss at 4150.0.
Scenario
| Timeframe | Weekly |
| Recommendation | BUY STOP |
| Entry Point | 4180.0 |
| Take Profit | 4380.0 |
| Stop Loss | 4100.0 |
| Key Levels | 3870.0, 4060.0, 4180.0, 4380.0 |
Alternative Scenario
| Recommendation | SELL STOP |
| Entry Point | 4060.0 |
| Take Profit | 3870.0 |
| Stop Loss | 4150.0 |
| Key Levels | 3870.0, 4060.0, 4180.0, 4380.0 |
