

The Democratic victory in both chambers of Congress has raised hopes among investors that at least some of the recently introduced tariffs could be lifted and the US–Canada trade dispute resolved. Since August, the two countries have imposed higher tariffs covering C$27.6 billion worth of goods on each side, weighing on economic growth. Trade talks between Washington and Ottawa are underway, though progress has been slow. On November 3, Canadian Prime Minister Mark Carney said the White House had dropped several earlier demands, including one that would have given Washington the final say over any trade agreements Canada might sign with other countries. September trade data provided further support for the Canadian dollar. Merchandise exports increased from C$78.41 billion to C$78.55 billion, while imports fell from C$73.46 billion to C$73.20 billion. The surplus widened to C$5.35 billion, its highest since May 2022. Exports to the US rose by 0.7% despite higher US tariffs, mainly on stronger shipments of crude oil and gold, according to Statistics Canada's September merchandise trade report.
The US dollar is under pressure as the election outcome raises hopes that the conflict between the US and Iran could be resolved sooner or that fighting could be put on hold. This could reduce the risk of renewed inflation and allow the Federal Reserve to adjust interest rates more cautiously. Traders were still pricing in a 79.5% chance of a December rate hike at the time of the analysis. Weaker US business activity data for October added pressure on the dollar, with the services PMI falling from 58.8 to 56.1 and the composite PMI declining from 58.4 to 55.9.
Support and Resistance Levels
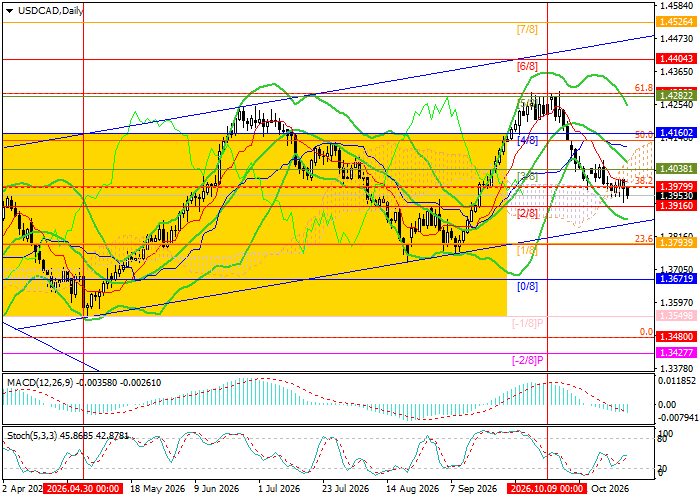
USD/CAD has entered the 1.3916–1.3979 support zone, bounded by Murrey Math [2/8] and the 38.2% Fibonacci retracement. A sustained move below this zone could take the pair through the lower boundary of the channel and turn the trend lower, with targets at 1.3793 (Murrey Math [1/8], 23.6% Fibonacci retracement), 1.3671 (Murrey Math [0/8]) and 1.3480 (0.0% Fibonacci retracement). A break back above 1.4160 (Murrey Math [4/8]) could see the pair resume its advance towards 1.4404 (Murrey Math [6/8]) and 1.4526 (Murrey Math [7/8], the upper boundary of the ascending channel). The pair's earlier test of this support area was covered in our previous USD/CAD forecast.
Technical indicators continue to give a sell signal. The Bollinger Bands are turning down, and the negative MACD histogram bars are expanding. The Stochastic oscillator has turned higher from oversold territory, leaving room for a limited rebound.
Resistance levels: 1.4160, 1.4404, 1.4526.
Support levels: 1.3916, 1.3793, 1.3671, 1.3480.
USD/CAD Trading Scenarios and Exchange Rate Forecast
Short positions may be considered below 1.3916, with targets at 1.3793, 1.3671 and 1.3480 and a stop-loss at 1.4010. The estimated holding period is 5–7 days. Long positions may be considered above 1.4160, with targets at 1.4404 and 1.4526 and a stop-loss at 1.4040.
Scenario
| Timeframe | Weekly |
| Recommendation | SELL STOP |
| Entry Point | 1.3916 |
| Take Profit | 1.3793, 1.3671, 1.3480 |
| Stop Loss | 1.4010 |
| Key Levels | 1.3480, 1.3671, 1.3793, 1.3916, 1.4160, 1.4404, 1.4526 |
Alternative Scenario
| Recommendation | BUY STOP |
| Entry Point | 1.4160 |
| Take Profit | 1.4404, 1.4526 |
| Stop Loss | 1.4040 |
| Key Levels | 1.3480, 1.3671, 1.3793, 1.3916, 1.4160, 1.4404, 1.4526 |
