

The decline followed the Democratic victory in the US midterm elections, with some Democratic lawmakers advocating tighter oversight and restrictions on artificial intelligence (AI). As the new week approached, some analysts suggested that the sector's importance to the US economy could limit the scope of broad restrictions, although measures at the state level remained possible. Texas Governor-elect Gina Hinojosa has called for a pause in new data centre approvals until legislation protecting local communities is introduced. Investors are also focusing on the Federal Reserve's December meeting, when the federal funds target range could rise to 4.00–4.25%. At its October meeting, the Fed kept the range at 3.75–4.00%. The election outcome and concerns about slower AI investment have complicated the outlook for further tightening, although another increase remains possible.
In the bond-market snapshot, the 10-year Treasury yield stood at 4.872%, slightly below the 4.886% recorded last week. The 20-year yield declined from 5.361% to 5.307%, while the 30-year Treasury bond yielded 5.273%, compared with 5.295% previously. The role of monetary policy and Treasury yields in the index's outlook was also discussed in our previous Dow Jones forecast.
In the latest completed US session, gainers included NVIDIA Corp. (+2.78%), Honeywell International Inc. (+1.98%), Johnson & Johnson (+1.43%), Caterpillar Inc. (+0.90%) and The Boeing Co. (+0.52%).
The largest declines included Salesforce Inc. (–3.94%), Nike Inc. (–2.45%), Cisco Systems Inc. (–1.95%), The Travelers Companies Inc. (–1.91%) and The Home Depot Inc. (–1.85%).
Support and Resistance Levels
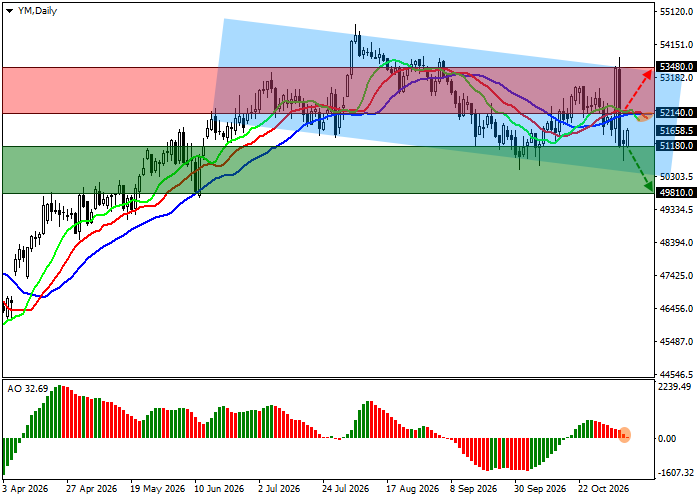
The daily technical setup points to an attempted rebound within a local descending channel.
Technical indicators have strengthened their sell signal since the beginning of the month. The Alligator indicator's exponential moving averages (EMAs) are spreading downward, while the Awesome Oscillator (AO) histogram is forming new corrective bars in negative territory.
Support levels: 51180.0, 49810.0.
Resistance levels: 52140.0, 53480.0.
DJIA Trading Scenarios and Index Forecast
Short positions may be considered after the price declines and consolidates below 51180.0, targeting 49810.0 with a stop-loss at 51700.0. The estimated holding period is seven days or more.
Long positions may be considered after the price rises and consolidates above 52140.0, targeting 53480.0 with a stop-loss at 51500.0.
Scenario
| Timeframe | Weekly |
| Recommendation | SELL STOP |
| Entry Point | 51180.0 |
| Take Profit | 49810.0 |
| Stop Loss | 51700.0 |
| Key Levels | 49810.0, 51180.0, 52140.0, 53480.0 |
Alternative Scenario
| Recommendation | BUY STOP |
| Entry Point | 52140.0 |
| Take Profit | 53480.0 |
| Stop Loss | 51500.0 |
| Key Levels | 49810.0, 51180.0, 52140.0, 53480.0 |
