

A key point of the document, in particular, will be the unblocking of the Strait of Hormuz, through which around 20.0% of global “black gold” volumes were transported before the acute phase of the conflict began. Nevertheless, the Baltic and International Maritime Council (BIMCO) considers crossing this key route very risky due to sea mines. At the same time, according to estimates, a return to pre-war supply volumes can realistically be expected only in 2027 and only if the agreement is observed normally and production recovers quickly. Market participants also expect the announced lifting of sanctions on Iran’s oil sector, including the removal of the embargo, which will undoubtedly significantly increase the supply of “black gold.” Before the start of hostilities, Iran produced 3.5 million barrels per day and exported 1.5–1.9 million barrels per day, mainly to China, but now the number of potential buyers may increase significantly.
Meanwhile, the United States has become the world’s largest oil exporter for the first time since the start of the military conflicts in Ukraine and the Middle East, according to vessel-tracking service Vortex Service B.V. In May, average volumes were recorded at around 10.5 million barrels per day, displacing Saudi Arabia (5.9 million barrels) and Russia (7.0 million barrels) from the leading positions. After 2010, oil and gas production from shale formations increased sharply, as a result of which the United States, for example, became the main importer of crude oil into the EU and the second-largest supplier of fuel distillates to the region. At the same time, warnings are increasingly being voiced about excessive dependence on a single partner. Meanwhile, according to the national Department of Energy, the volume of “black gold” in the U.S. Strategic Petroleum Reserve has fallen to its lowest level since 1983. Last week alone, U.S. authorities released another 8.9 million barrels of oil to the market, while the decline in volumes itself is part of the planned release of 172.0 million barrels announced by the Republican administration in March.
Meanwhile, the Chicago Mercantile Exchange (CME Group) plans to introduce round-the-clock trading in new WTI Crude Oil futures, sized at one-tenth of the Micro WTI contract, which will be launched on August 30.
Support and resistance levels
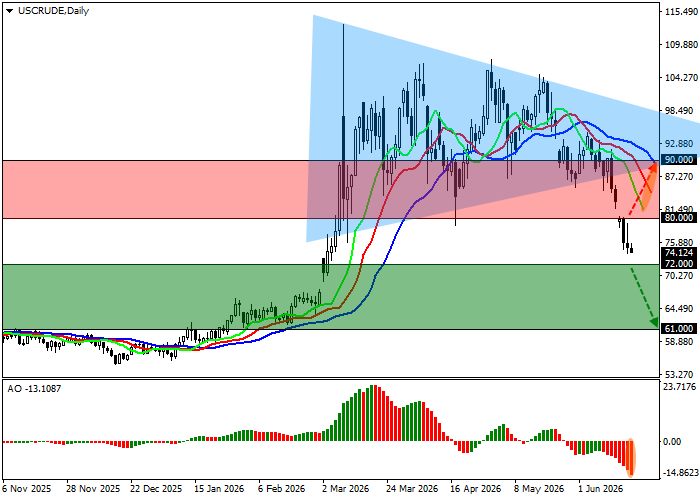
On the daily chart, quotes are declining as part of the development of a downward wave after leaving the “triangle” pattern with boundaries at 100.00–85.00, currently moving away from the support line.
Technical indicators maintain a relatively stable sell signal, which was received at the beginning of the month: the fast EMAs on the Alligator indicator are below the signal line, expanding the fluctuation range, while the AO histogram is forming new downward bars below the transition level.
Support levels: 72.00, 61.00.
Resistance levels: 80.00, 90.00.
WTI Crude Oil trading scenarios and forecast
Short positions should be opened after the price consolidates below 72.00, with a target at 61.00. Stop-loss — 76.00. Expected timeframe: 7 days or more.
Long positions should be opened after the price consolidates above 80.00, with a target at 90.00. Stop-loss — 77.00.
Scenario
| Timeframe | Weekly |
| Recommendation | SELL STOP |
| Entry point | 71.95 |
| Take Profit | 61.00 |
| Stop Loss | 76.00 |
| Key levels | 61.00, 72.00, 80.00, 90.00 |
Alternative scenario
| Recommendation | BUY STOP |
| Entry point | 80.05 |
| Take Profit | 90.00 |
| Stop Loss | 77.00 |
| Key levels | 61.00, 72.00, 80.00, 90.00 |
