

Sterling came under pressure following the release of the final July UK manufacturing data. The S&P Global Manufacturing PMI fell to 51.9 from 52.5 in June, reaching a four-month low and coming in below the preliminary estimate of 52.8. Nevertheless, the details of the report were more resilient than the headline figure suggested: manufacturing output expanded at its fastest pace in almost two years, while new orders and export sales continued to increase.
The labour-market picture remained weaker. Employment was broadly unchanged, while small manufacturers reported a modest decline in production, in contrast to continued growth among medium-sized and large companies. At the same time, input-cost inflation slowed to its lowest level since February as pressure on supply chains eased.
Further disruption in the Middle East and restrictions affecting shipping through the Strait of Hormuz could still raise energy, freight and production costs. A prolonged shock would weaken the UK growth outlook while keeping inflationary pressure elevated, complicating the Bank of England’s policy decisions.
US manufacturing data were stronger. According to the Institute for Supply Management, the Manufacturing PMI rose from 53.3 to 55.6 in July, its highest level since May 2022. New orders, production and employment remained in expansion territory, supporting demand for the US dollar.
However, the manufacturing data alone do not confirm that the Federal Reserve is preparing an imminent interest-rate increase. New York Fed President John Williams recently said that inflation remained too high but was expected to ease in the coming quarters as the effects of tariffs, energy prices and supply disruptions gradually diminished. Persistent inflation would nevertheless keep the possibility of additional monetary tightening on the table.
FORECK.INFO previously examined the pound’s sensitivity to UK economic data and US monetary policy expectations in an earlier GBP/USD forecast.
Support and Resistance Levels
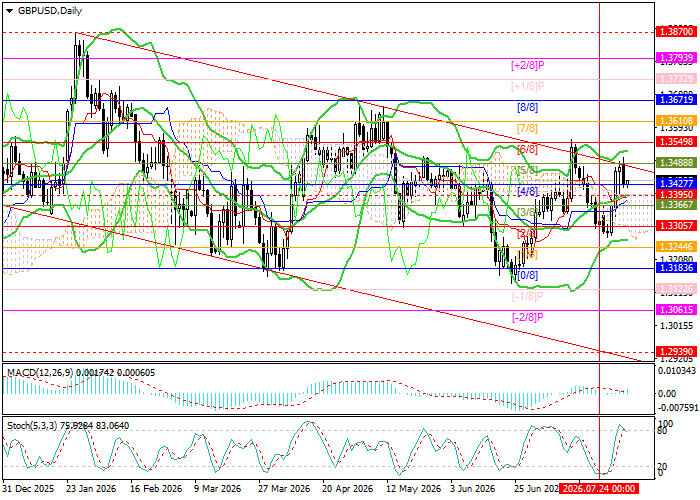
The trading instrument is testing the upper boundary of the descending channel. A breakout above 1.3488, the Murrey [5/8] level, could allow the pair to leave the channel and advance toward 1.3671, the Murrey [8/8] level, followed by 1.3793, the Murrey [+2/8] level, and 1.3870, the area of the yearly highs.
However, if the price consolidates below the middle Bollinger Band at 1.3395, a decline toward 1.3183, the Murrey [0/8] level, 1.3061, the Murrey [–2/8] level, and 1.2939, the Murrey [2/8] level on the weekly chart, could follow.
Technical indicators do not provide a unified signal. The Bollinger Bands are turning upward, the MACD histogram remains close to the zero line with limited momentum, while the Stochastic Oscillator has entered the overbought zone and is attempting to reverse downward.
Resistance levels: 1.3488, 1.3671, 1.3793, 1.3870.
Support levels: 1.3395, 1.3183, 1.3061, 1.2939.
GBP/USD Trading Scenarios and Price Forecast
Short positions may be opened below 1.3395 with targets at 1.3183, 1.3061 and 1.2939 and a stop-loss at 1.3465. Time horizon: 5–7 days.
Long positions may be opened above 1.3488 with targets at 1.3671, 1.3793 and 1.3870 and a stop-loss at 1.3400.
Scenario
| Timeframe | Weekly |
| Recommendation | SELL STOP |
| Entry Point | 1.3395 |
| Take Profit | 1.3183, 1.3061, 1.2939 |
| Stop Loss | 1.3465 |
| Key Levels | 1.2939, 1.3061, 1.3183, 1.3395, 1.3488, 1.3671, 1.3793, 1.3870 |
Alternative Scenario
| Recommendation | BUY STOP |
| Entry Point | 1.3488 |
| Take Profit | 1.3671, 1.3793, 1.3870 |
| Stop Loss | 1.3400 |
| Key Levels | 1.2939, 1.3061, 1.3183, 1.3395, 1.3488, 1.3671, 1.3793, 1.3870 |
