

The Islamic Revolutionary Guard Corps (IRGC) maintains control over the Strait of Hormuz, through which around one-fifth of global hydrocarbon shipments previously passed. Currently, only vessels from allied countries such as Russia, China, India, Pakistan, and Iraq are allowed to transit, while more than 100 tankers from other nations remain blocked. As a result, Saudi Arabia, Kuwait, and the United Arab Emirates are being forced to reduce production as storage facilities fill up. According to the International Energy Agency (IEA), oil and petroleum exports from the region have dropped to just 10.0% of pre-escalation levels. On March 26, Yemen’s Houthi forces, aligned with Iran, announced plans to block the Bab el-Mandeb Strait, which connects the Gulf of Aden and the Red Sea, where Saudi oil supplies are currently being redirected via the East-West pipeline. Meanwhile, Israeli forces continue to strike Iranian targets, while Tehran is attempting to attack US military bases in Bahrain, Qatar, Kuwait, and the UAE. Reports also indicate that the US Department of Defense has deployed an additional 2,500 Marines and special forces personnel for a potential ground operation.
In recent weeks, the influence of US President Donald Trump’s rhetoric on energy markets has declined significantly, reflecting a shift from high volatility to a more устойчивый price trend. Previously, his comments about a potential de-escalation pushed oil prices down by 10.0–15.0%, whereas similar statements now trigger only short-term moves of 1.0–3.0%. According to The Wall Street Journal, on March 30 the US president expressed readiness to end the confrontation even if the Strait of Hormuz remains partially blocked, citing that key objectives—such as containing Iran’s naval and missile capabilities—have already been achieved. Following these remarks, Brent Crude Oil briefly corrected from 86.50 to 85.80 before resuming its upward movement within a day, highlighting continued supply constraints and geopolitical risks.
Today, US investors are focused on March labor market data. At 14:15 (GMT+2), the ADP report on private sector employment will be released, ahead of the official US Department of Labor data scheduled for Friday at 14:30 (GMT+2). Meanwhile, traders continue to assess February JOLTS data published earlier: job openings fell from a revised 7.240 million to 6.882 million, while hires declined by 498,000 to 4.849 million—the lowest level since April 2020. The hiring rate dropped to 3.1%, marking the lowest level since 2011.
Support and resistance levels
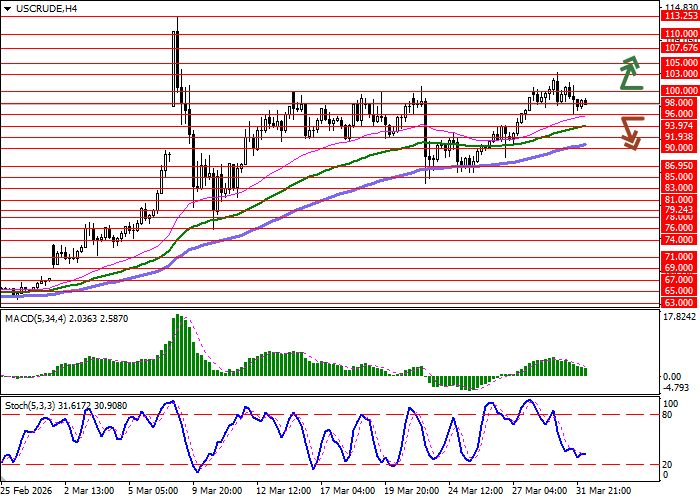
On the daily chart, Bollinger Bands are attempting to flatten, with the price range slightly expanding upward and allowing bulls room for further gains. The MACD indicator is generating a sell signal as the histogram moves below the signal line, while the Stochastic oscillator is hovering near the “80” level, indicating a high probability of overbought conditions in the near term.
Resistance levels: 100.00, 103.00, 105.00, 107.67.
Support levels: 98.00, 96.00, 93.97, 91.93.
Trading scenarios and WTI Crude Oil outlook
Short positions can be opened at the current price with a target at 91.93. Stop-loss — 93.40. Implementation period: 1–2 days.
Long positions can be opened after a breakout above 100.00 with a target at 105.00. Stop-loss — 98.00.
Scenario
| Timeframe | Intraday |
| Recommendation | SELL STOP |
| Entry point | 92.80 |
| Take Profit | 91.93 |
| Stop Loss | 93.40 |
| Key levels | 91.93, 93.97, 96.00, 98.00, 100.00, 103.00, 105.00, 107.67 |
Alternative scenario
| Recommendation | BUY STOP |
| Entry point | 100.05 |
| Take Profit | 105.00 |
| Stop Loss | 98.00 |
| Key levels | 91.93, 93.97, 96.00, 98.00, 100.00, 103.00, 105.00, 107.67 |
