

On the bullish side for the dollar, the minutes of the latest Federal Reserve meeting showed that most officials consider monetary tightening appropriate if inflation remains persistently above the 2.0% target, and called for removing language from the final statement that implied a possible return to dovish rhetoric. These views were expressed before the release of April's Consumer Price Index, which hit a three-year peak of 3.8%. Combined with a resilient labor market — unemployment holding at 4.3% and non-farm payrolls adding 115,000 jobs versus the 65,000 forecast — this reinforces hawkish sentiment among Fed officials and increases market confidence that rates will remain on hold at least through year-end, or could even be raised in December.
The yen, meanwhile, is drawing support from Japanese macroeconomic data. Export volumes rose 14.8%, exceeding the 9.3% forecast, while imports grew 9.7% against an expected 8.3%, resulting in a narrowing of the trade surplus from ¥643.0 billion to ¥301.9 billion. Sales dynamics reached their strongest level in five months, driven by semiconductor shipments — up 15.5% to China and 9.5% to the United States. Combined with the first-quarter GDP data released the previous day, which showed growth of 2.1% year-on-year, these figures confirm the resilience of the Japanese economy — which is holding up against the energy and tariff crisis — and give the Bank of Japan room to continue tightening monetary policy.
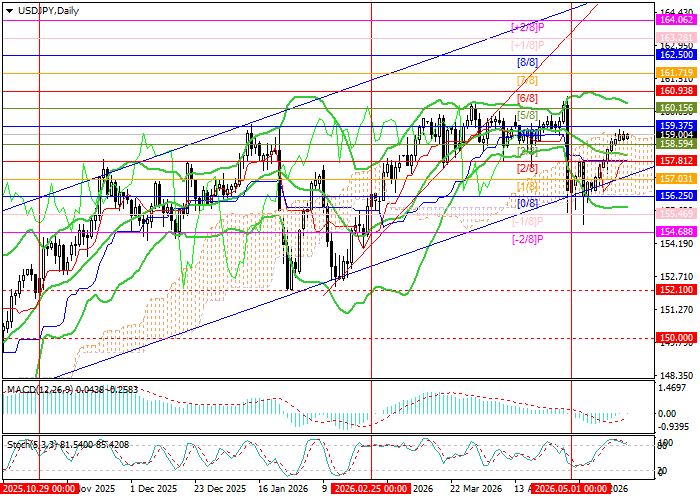
Support and Resistance Levels
The pair reversed from the lower boundary of the long-term ascending channel at 156.25 and is approaching 159.37 (Murray level [4/8]). A confirmed close above this level would open the way toward 160.93 (Murray level [6/8], upper Bollinger Band), 162.50 (Murray level [8/8]), and 164.06 (Murray level [+2/8]). Conversely, a break below 156.25 (Murray level [0/8]) could trigger a trend reversal and a move toward 154.68 (Murray level [–2/8]) and 152.10 (the January low).
Technical indicators are sending mixed signals: the Bollinger Bands are turning downward, the MACD histogram is preparing to cross into positive territory and generate a buy signal, while the Stochastic is near the overbought zone — leaving the door open to a near-term reversal.
Resistance levels: 159.37, 160.93, 162.50, 164.06.
Support levels: 156.25, 154.68, 152.10.
USD/JPY Trading Scenarios and Price Forecast
Long positions can be opened above 159.37, targeting 160.93, 162.50, and 164.06, with a stop-loss at 158.25. Time horizon: 5–7 days.
Short positions can be opened below 156.25, targeting 154.68 and 152.10, with a stop-loss at 157.30.
| Scenario | |
|---|---|
| Timeframe | Weekly |
| Recommendation | BUY STOP |
| Entry Point | 159.40 |
| Take Profit | 160.93, 162.50, 164.06 |
| Stop Loss | 158.25 |
| Key Levels | 152.10, 154.68, 156.25, 159.37, 160.93, 162.50, 164.06 |
| Alternative Scenario | |
|---|---|
| Recommendation | SELL STOP |
| Entry Point | 156.20 |
| Take Profit | 154.68, 152.10 |
| Stop Loss | 157.30 |
| Key Levels | 152.10, 154.68, 156.25, 159.37, 160.93, 162.50, 164.06 |
