

The negative price action is being driven by news of an upcoming initial public offering (IPO) by Space Exploration Technologies Corp. (SpaceX), which — like Tesla — is owned by Elon Musk. Analysts are concerned that the entrepreneur's attention may now shift significantly away from the already-listed company toward the new issuer, as the space venture could prove more profitable. SpaceX is currently the industry leader, while Tesla's sales volumes are declining under pressure from Chinese electric vehicle manufacturers. That said, some analysts suggest that if SpaceX manages to attract a valuation of more than $2.0 trillion at its June 12 listing, the resulting investor interest could spill over into Musk's other assets. Additionally, on Monday a jury dismissed Musk's lawsuit against OpenAI and its CEO Sam Altman, citing the expiry of the three-year statute of limitations.
Fundamental factors are therefore not supportive of a meaningful price recovery, and the stock has been unable to break back above the Bollinger Bands middle line at $406.25. Nevertheless, this could occur in the near term due to additional monetary pressure on equity markets: the minutes of the latest Federal Reserve meeting showed that most officials lean toward keeping interest rates elevated for an extended period or even raising them further. With the April Consumer Price Index rising from 3.3% to a three-year peak of 3.8% — above the expected 3.7% — and the Producer Price Index climbing from 4.3% to 6.0%, further monetary tightening in the medium term appears increasingly likely.
Support and Resistance Levels
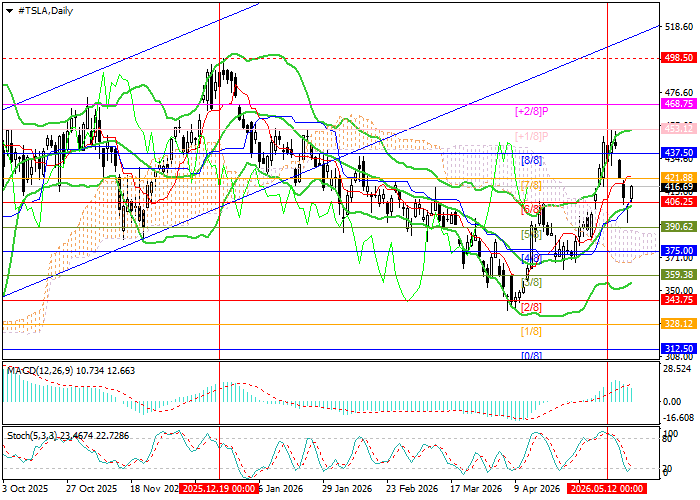
The stock is currently trading close to the Bollinger Bands middle line at $406.25 (Murray level [6/8]). A confirmed close below it would open the way toward $375.00 (Murray level [4/8]), $343.75 (Murray level [2/8]), and $312.50 (Murray level [0/8]). Conversely, a renewed breakout above $437.50 (Murray level [8/8]) would be expected to drive the stock toward $468.75 (Murray level [+2/8]) and $498.50 (the December high).
Technical indicators are sending mixed signals: the Bollinger Bands are pointing upward, the MACD histogram is expanding in negative territory, and the Stochastic has reached the oversold zone — leaving the door open to a reversal. On the weekly chart, the Bollinger Bands continue to point downward, confirming the formation of a downtrend.
Resistance levels: 437.50, 468.75, 498.50.
Support levels: 406.25, 375.00, 343.75, 312.50.
Tesla Inc. Stock Forecast and Trading Scenarios
Short positions can be opened below $406.25, targeting $375.00, $343.75, and $312.50, with a stop-loss at $427.50. Time horizon: 5–7 days. Long positions can be opened above $437.50, targeting $468.75 and $498.50, with a stop-loss at $416.30.
| Scenario | |
|---|---|
| Timeframe | Weekly |
| Recommendation | SELL STOP |
| Entry Point | 406.20 |
| Take Profit | 375.00, 343.75, 312.50 |
| Stop Loss | 427.50 |
| Key Levels | 312.50, 343.75, 375.00, 406.25, 437.50, 468.75, 498.50 |
| Alternative Scenario | |
|---|---|
| Recommendation | BUY STOP |
| Entry Point | 437.55 |
| Take Profit | 468.75, 498.50 |
| Stop Loss | 416.30 |
| Key Levels | 312.50, 343.75, 375.00, 406.25, 437.50, 468.75, 498.50 |
