

Market participants also remain focused on preliminary May business activity data from eurozone countries, which were generally weak: the manufacturing indicator declined from 52.2 points to 51.4 points, more sharply than the expected 51.7 points, while the services index fell from 47.6 points to 46.4 points against expectations of 47.8 points. The composite indicator dropped from 48.8 points to 47.5 points. Analysts at S&P Global noted that the data “show that the eurozone economy is facing increasingly serious pressure from the conflict in the Middle East,” emphasizing that output has been declining for the second consecutive month, with the pace of contraction accelerating in May. This means the economy could slow by 0.2% as early as the second quarter. Data from France were especially weak: the composite indicator fell to a 66-month low of 43.5 points from 47.6 points in April, the services sector declined to 42.9 points, and the manufacturing sector reached 48.9 points. In Germany, the data showed a correction from 51.4 points to 49.9 points and from 46.9 points to 47.8 points, respectively, while the composite indicator rose from 48.4 points to 48.6 points.
The updated macroeconomic forecast of the European Commission also reflects the growing pressure of geopolitical destabilization on the regional economy amid the escalation of the US-Iran conflict, which has already caused serious logistical problems, primarily affecting energy supplies through the Strait of Hormuz. The forecast for aggregate EU GDP growth was revised to 1.1%, compared with the previously expected 1.5%, while the inflation forecast was also raised to 3.1%. The acceleration in price pressure is mainly driven by the energy component: rising oil and liquefied natural gas prices have increased production costs, weakened profitability in the European industrial sector and reduced consumer activity. Additional pressure on expectations comes from increased volatility in debt and currency markets, as well as weaker business confidence in the bloc’s export-oriented economies. According to several European research institutes, the cost of imported energy for the EU rose by more than 18.0% year-on-year in the second quarter, increasing the risks of stagflation in the manufacturing and transport sectors. The German economy remains the most vulnerable in the region: the European Commission expects it to grow by only 0.6% this year after actual stagnation last year, due to limited domestic demand, the high energy intensity of industrial production and weaker export dynamics, despite large-scale public investment in infrastructure and defense. At the same time, the expected rise in the country’s budget deficit to 3.7–4.1% of GDP in 2026–2027 points to a gradual weakening of fiscal stability. In the medium term, a moderate recovery to 1.4% next year is possible, provided consumer price inflation slows toward 2.4%. Despite the EU’s reduced dependence on Russian energy and the growing share of renewable generation, the current crisis confirms that the region’s economy remains sensitive to external energy shocks and geopolitical factors.
US investors focused the previous day on traditional jobless claims data: for the week ending May 15, initial claims declined from the previous 212.0 thousand to 209.0 thousand, close to the preliminary estimate of 210.0 thousand, while the continuing claims figure rose from 1.776 million to 1.782 million, compared with expectations of 1.790 million. Meanwhile, the US business activity report was significantly stronger than the European one. In May, the manufacturing indicator rose from 54.5 points to 55.3 points, while investors had expected a slowdown to 54.0 points, and the services index changed from 51.0 points to 50.9 points.
Support and resistance levels
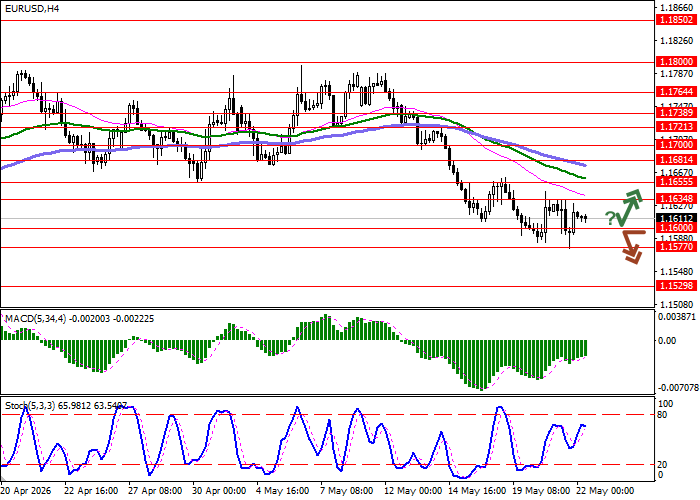
On the daily chart, the Bollinger Bands are showing a moderate decline: the price range is expanding downward, giving bears room to move toward local lows. The MACD is attempting to turn upward, preparing to form a new buy signal and move above the signal line. The Stochastic is showing more confident growth, signaling in favor of a full short-term upward trend.
Resistance levels: 1.1634, 1.1655, 1.1681, 1.1700.
Support levels: 1.1600, 1.1577, 1.1529, 1.1500.
Trading scenarios and EUR/USD forecast
Short positions may be opened after a confident breakout below 1.1600, with a target at 1.1529. Stop-loss — 1.1634. Expected timeframe: 1–2 days.
A rebound from 1.1600 as support, followed by a breakout above 1.1634, may become a signal to open new long positions with a target at 1.1700. Stop-loss — 1.1600.
Scenario
| Timeframe | Intraday |
| Recommendation | SELL STOP |
| Entry point | 1.1595 |
| Take Profit | 1.1529 |
| Stop Loss | 1.1634 |
| Key levels | 1.1500, 1.1529, 1.1577, 1.1600, 1.1634, 1.1655, 1.1681, 1.1700 |
Alternative scenario
| Recommendation | BUY STOP |
| Entry point | 1.1635 |
| Take Profit | 1.1700 |
| Stop Loss | 1.1600 |
| Key levels | 1.1500, 1.1529, 1.1577, 1.1600, 1.1634, 1.1655, 1.1681, 1.1700 |
