
The market remains under pressure amid the escalation of the US-Iran conflict in the Persian Gulf, with reports of renewed exchanges of strikes. Attacks by Iran’s Islamic Revolutionary Guard Corps (IRGC) on vessels attempting to pass through the Strait of Hormuz have reportedly become more frequent, while traffic through the waterway remains limited. The same geopolitical factors continue to support Brent oil prices. In addition, the asset is influenced by the dynamics of US government bond yields, which could come under pressure after the US Treasury announced on September 9 that it would conduct a buyback operation of up to $6.0 billion in long-dated securities. The Treasury’s debt-management decisions and related documents are published through its official refinancing process. At present, the yield on 10-year bonds has reached around 4.85%, its highest level since 2023, and it is unlikely that the government operation alone will reverse the broader trend. It should be noted that at the end of August, the gold-to-silver ratio widened to 1:70 and currently stands near 1:65, while its average level in recent months has been around 1:60. Thus, the XAU/USD pair continues to outperform its counterpart in terms of volatility, and short-term investors may seek to narrow the valuation gap between the precious metals, which could support XAG/USD.
In the second half of last month, trading volume in silver contracts on the Chicago Mercantile Exchange (CME Group) began to rise gradually, but from the first days of September it declined again toward the summer median. Thus, on September 8, the number of futures positions reached 59.0 thousand, compared with a peak of 101.2 thousand positions recorded on August 28, while 4.5 thousand options transactions were significantly below the August average of 7.6 thousand.
Support and resistance levels
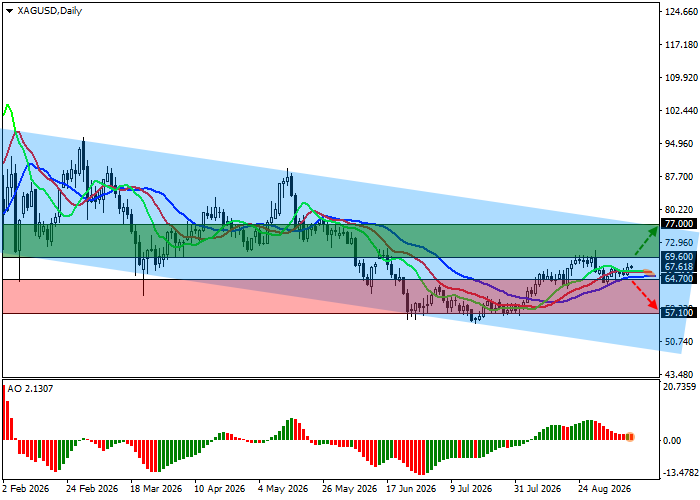
On the daily chart, the trading instrument is positioned below the resistance line of a global descending channel with dynamic boundaries of 77.00–50.00.
Technical indicators maintain a stable buy signal: the fluctuation range of the Alligator indicator’s EMAs remains intact and is directed upward, while the Awesome Oscillator histogram is forming corrective bars in positive territory.
Support levels: 64.70, 57.10.
Resistance levels: 69.60, 77.00.
XAG/USD trading scenarios and forecast
Long positions may be opened after the price rises and consolidates above 69.60, with a target at 77.00. Stop loss: 67.00. Implementation period: seven days or more.
Short positions may be opened after the price declines and consolidates below 64.70, with a target at 57.10. Stop loss: 67.00.
Scenario
| Timeframe | Weekly |
| Recommendation | BUY STOP |
| Entry point | 69.60 |
| Take Profit | 77.00 |
| Stop Loss | 67.00 |
| Key levels | 57.10, 64.70, 69.60, 77.00 |
Alternative scenario
| Recommendation | SELL STOP |
| Entry point | 64.70 |
| Take Profit | 57.10 |
| Stop Loss | 67.00 |
| Key levels | 57.10, 64.70, 69.60, 77.00 |
