

On the daily chart, the price is developing a global corrective movement, approaching the support line of a recently formed ascending channel with dynamic boundaries of 86.00–72.00.
On the four-hour chart, quotes are positioned above the previous annual low of 65.50, confirming the probability of an upward correction toward 87.00. However, if the price consolidates below the support level of 73.00, the asset is expected to decline.
Technical indicators maintain a buy signal: the fast EMAs of the Alligator indicator are above the slow ones, narrowing the fluctuation range, while the Awesome Oscillator histogram is forming declining bars in positive territory.
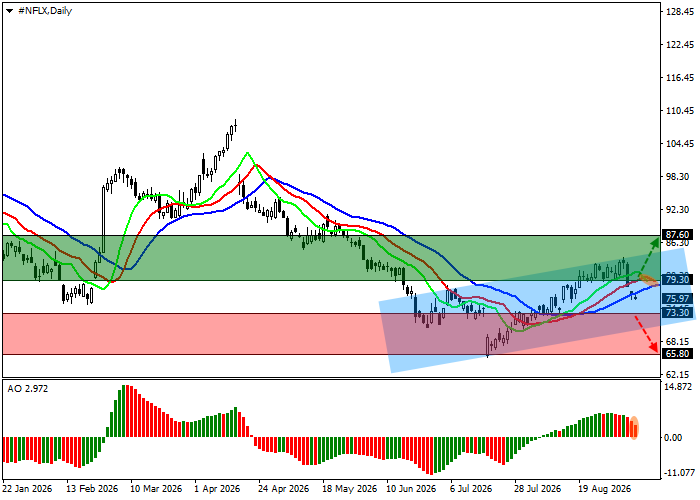
Netflix Inc. trading scenarios and forecast
Long positions may be opened after the price rises and consolidates above 79.30, with a target at 87.60. Stop loss: 76.00. Implementation period: seven days or more.
Short positions may be opened after the price declines and consolidates below 73.30, with a target at 65.80. Stop loss: 76.00.
Scenario
| Timeframe | Weekly |
| Recommendation | BUY STOP |
| Entry point | 79.30 |
| Take Profit | 87.60 |
| Stop Loss | 76.00 |
| Key levels | 65.80, 73.30, 79.30, 87.60 |
Alternative scenario
| Recommendation | SELL STOP |
| Entry point | 73.30 |
| Take Profit | 65.80 |
| Stop Loss | 76.00 |
| Key levels | 65.80, 73.30, 79.30, 87.60 |
