

On the daily chart, the price is positioned below the support line of a local ascending channel with dynamic boundaries of 600.00–575.00, preparing to continue its decline.
On the four-hour chart, quotes are located near the previous low of 557.00, confirming a high probability that negative dynamics will persist. After consolidating below this level, the price may reach the global trend support level of 532.00 within the descending trend.
Technical indicators are weakening the sell signal as the upward trend that began in summer comes to an end: the fast EMAs of the Alligator indicator are approaching the slow ones, narrowing the fluctuation range, while the Awesome Oscillator histogram is forming declining bars in positive territory.
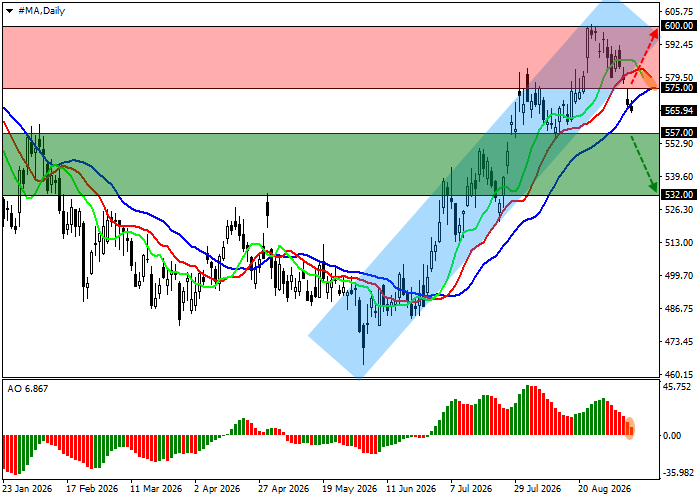
Mastercard Inc. trading scenarios and forecast
Short positions may be opened after the price declines and consolidates below 557.00, with a target at 532.00. Stop loss: 570.00. Implementation period: seven days or more.
Long positions may be opened after the price rises and consolidates above 575.00, with a target at 600.00. Stop loss: 565.00.
Scenario
| Timeframe | Weekly |
| Recommendation | SELL STOP |
| Entry point | 557.00 |
| Take Profit | 532.00 |
| Stop Loss | 570.00 |
| Key levels | 532.00, 557.00, 575.00, 600.00 |
Alternative scenario
| Recommendation | BUY STOP |
| Entry point | 575.00 |
| Take Profit | 600.00 |
| Stop Loss | 565.00 |
| Key levels | 532.00, 557.00, 575.00, 600.00 |
