

Intermittent signs of easing tensions in the Persian Gulf have not removed the risks associated with disrupted shipping through the Strait of Hormuz. European benchmark natural gas prices rose above €70 per megawatt-hour in the middle of the week, approaching their highest level since 2023, while Brent crude futures traded near $95.00–96.00 per barrel.
Higher energy costs have added to inflationary pressure. According to Eurostat, annual inflation in the euro area accelerated from 2.9% to 3.3% in August, exceeding the European Central Bank’s 2.0% target and strengthening expectations of another rate increase.
The outlook for tighter monetary policy was also supported by euro-area producer prices, which rose by 5.8% year-on-year in July after increasing by 4.6% in June. Similar inflation and earnings risks are also influencing France’s CAC 40.
German government bond yields remain elevated, limiting the equity market’s upside potential. The 10-year Bund yield stood at 3.350%, slightly below 3.378% in the previous week. The 20-year yield declined from 3.773% to 3.753%, while the 30-year yield eased from 3.847% to 3.826%.
Among the strongest DAX performers in the previous session were Volkswagen AG (+3.61%), Porsche Automobil Holding SE (+2.64%), Vonovia SE (+2.62%), SAP SE (+2.28%) and Commerzbank AG (+2.26%).
The largest declines were recorded by Fresenius Medical Care AG (–1.93%), Rheinmetall AG (–1.85%), Siemens Healthineers AG (–1.65%), Merck KGaA (–1.54%) and Siemens AG Class N (–1.17%).
Support and Resistance
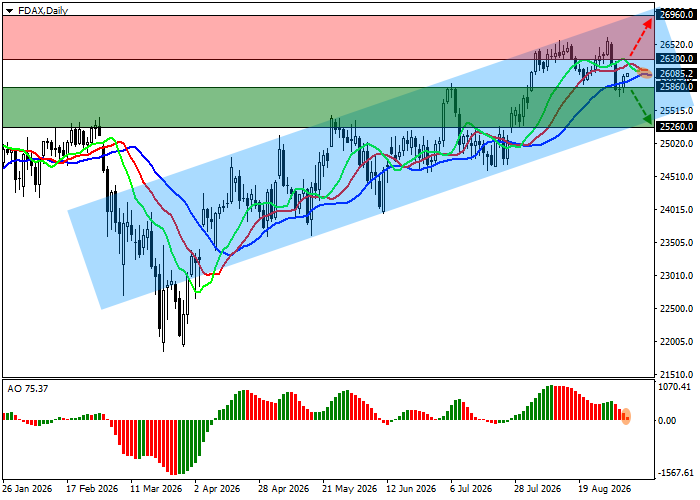
On the daily chart, the DAX 40 remains in a corrective trend and is approaching the lower boundary of the ascending channel between 25,300.0 and 27,000.0, formed in early March.
Technical indicators are weakening their buy signal. The fast EMAs of the Alligator indicator remain above the signal line, while the Awesome Oscillator histogram is forming declining bars in positive territory.
Support levels: 25,860.0, 25,260.0.
Resistance levels: 26,300.0, 26,960.0.
DAX 40 Trading Scenarios and Price Forecast
Short positions may be opened after the index declines and consolidates below 25,860.0, with a target at 25,260.0. Stop-loss: 26,100.0. Implementation period: seven days or more.
Long positions may be opened after the index rises and consolidates above 26,300.0, with a target at 26,960.0. Stop-loss: 26,000.0.
Scenario
| Timeframe | Weekly |
| Recommendation | SELL STOP |
| Entry Point | 25,860.0 |
| Take Profit | 25,260.0 |
| Stop Loss | 26,100.0 |
| Key Levels | 25,260.0, 25,860.0, 26,300.0, 26,960.0 |
Alternative Scenario
| Recommendation | BUY STOP |
| Entry Point | 26,300.0 |
| Take Profit | 26,960.0 |
| Stop Loss | 26,000.0 |
| Key Levels | 25,260.0, 25,860.0, 26,300.0, 26,960.0 |
