

Investor interest in gold as a safe-haven asset, which is relatively less exposed to market fluctuations, continues to be supported by persistent tensions in the Middle East, where the US-Iran confrontation is ongoing and the likelihood of a peaceful settlement in the near term remains low. Since the beginning of the week, reports have emerged of renewed mutual attacks, as well as intensifying strikes by Yemen’s Houthis on energy infrastructure facilities in Saudi Arabia. The Strait of Hormuz, a key maritime route for hydrocarbon exports from the Persian Gulf, remains subject to severe disruption. As a result, the energy crisis persists, driving up Brent prices and increasing the risk of another rise in global inflation.
In addition, the People’s Bank of China continues to purchase physical gold for the twenty-second consecutive month. Last month, the regulator increased its reserves by 650.0 thousand troy ounces, bringing the total to 76.73 million troy ounces. The value of the precious metal held by China consequently reached 350.08 billion dollars.
The approaching September meeting of the US Federal Reserve on monetary policy is having a key influence on the short-term trend. Given recent comments from Fed officials and forecasts that inflation will remain elevated above the 2.0% target, the probability of a 25-basis-point rate hike stands near 60.0%, according to the CME FedWatch Tool, somewhat limiting further gains in XAU/USD. Meanwhile, according to the latest CME Group reports, trading volumes remain below August averages: on September 4, 219.7 thousand futures positions and 61.6 thousand options contracts were recorded, broadly in line with statistics from the previous September sessions.
Support and resistance levels
On the daily chart, the trading instrument is correcting above the support line of a local ascending channel with dynamic boundaries of 4830.0–4300.0.
Technical indicators have weakened the stable buy signal: the fast EMAs of the Alligator indicator remain above the slow ones, while the Awesome Oscillator histogram is forming corrective bars in positive territory.
Support levels: 4310.0, 4050.0.
Resistance levels: 4480.0, 4680.0.
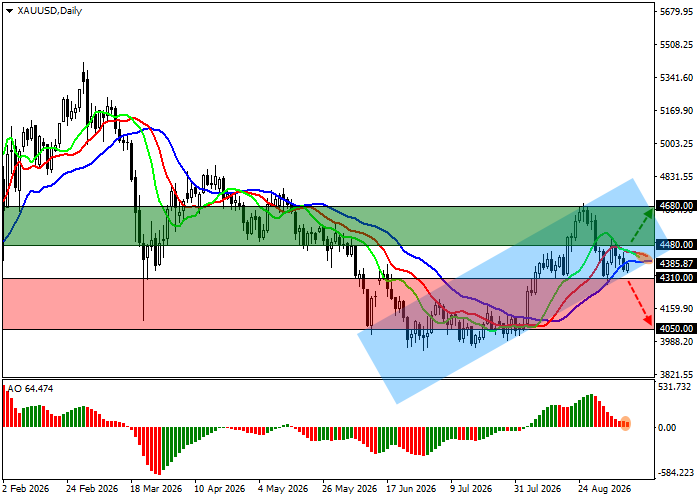
XAU/USD trading scenarios and forecast
Long positions may be opened after the price rises and consolidates above 4480.0, with a target at 4680.0. Stop loss: 4380.0. Implementation period: seven days or more.
Short positions may be opened after the price declines and consolidates below 4310.0, with a target at 4050.0. Stop loss: 4410.0.
Scenario
| Timeframe | Weekly |
| Recommendation | BUY STOP |
| Entry point | 4480.0 |
| Take Profit | 4680.0 |
| Stop Loss | 4380.0 |
| Key levels | 4050.0, 4310.0, 4480.0, 4680.0 |
Alternative scenario
| Recommendation | SELL STOP |
| Entry point | 4310.0 |
| Take Profit | 4050.0 |
| Stop Loss | 4410.0 |
| Key levels | 4050.0, 4310.0, 4480.0, 4680.0 |
