

The move is being driven by renewed geopolitical tensions in the Persian Gulf, where the United States and Iran continue to exchange strikes, while conflicting estimates are emerging about oil flows through the Strait of Hormuz. US Energy Secretary Chris Wright said that 17.0 million barrels of oil passed through the waterway on August 31, close to the pre-war daily average of around 20.0 million barrels. However, preliminary Kpler tracking data recorded only five visible commodity-vessel transits that day, none of which were liquid tankers. The Kpler figures exclude vessels operating with their transponders switched off, meaning the two estimates are not directly comparable. The latest rise extends the recovery discussed in FORECK.INFO’s previous Brent Crude Oil forecast.
Meanwhile, the American Petroleum Institute (API) estimated that US crude inventories fell by 2.600 million barrels after rising by 4.200 million barrels in the previous week. The official Energy Information Administration report showed a larger decline of 4.450 million barrels, following an increase of 0.095 million barrels previously. The draw reflected strong refinery demand and higher exports, providing additional support to oil prices. Activity in the broader oil derivatives market also remained high: according to CME Group data, approximately 985.0 thousand WTI futures contracts and 188.0 thousand options contracts were traded on September 1.
Support and Resistance Levels
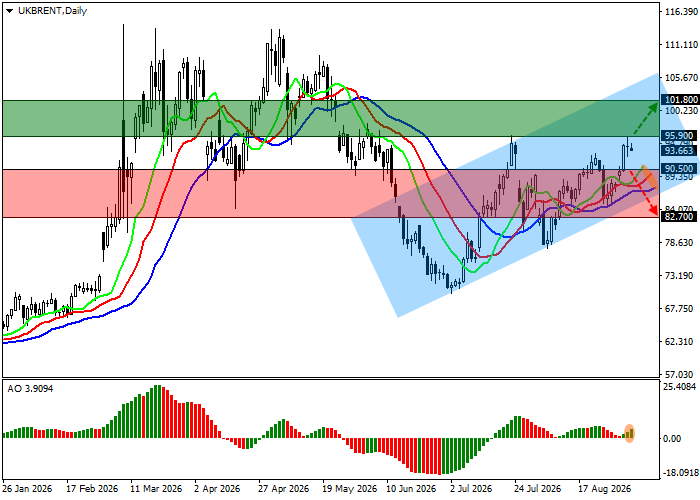
On the daily chart, Brent is advancing near the resistance line of an ascending channel with boundaries at 106.00–86.00.
Technical indicators are strengthening the buy signal: the fast EMAs of the Alligator indicator are moving further above the slow line, while the Awesome Oscillator histogram is forming corrective bars in positive territory.
Support levels: 90.50, 82.70.
Resistance levels: 95.90, 101.80.
Brent Crude Oil Trading Scenarios and Price Forecast
Long positions may be considered after a rise and consolidation above 95.90, with a target at 101.80 and a stop-loss at 94.00. Time horizon: seven days or longer.
Short positions may be considered after a decline and consolidation below 90.50, with a target at 82.70 and a stop-loss at 94.00.
Scenario
| Timeframe | Weekly |
| Recommendation | BUY STOP |
| Entry Point | 95.90 |
| Take Profit | 101.80 |
| Stop Loss | 94.00 |
| Key Levels | 82.70, 90.50, 95.90, 101.80 |
Alternative Scenario
| Recommendation | SELL STOP |
| Entry Point | 90.50 |
| Take Profit | 82.70 |
| Stop Loss | 94.00 |
| Key Levels | 82.70, 90.50, 95.90, 101.80 |
