
The positive trend remains intact despite proceedings initiated by OpenAI Inc. over Apple’s alleged improper fulfillment of partnership obligations. The cooperation, which has been in place since June 2024 and involved the integration of ChatGPT into Apple Inc. software, has reportedly failed to meet expectations. Management had expected the project to attract more users to the chatbot subscription and had counted on deeper integration with other Apple Inc. applications, as well as priority placement within the Siri assistant. However, the actual implementation has remained limited. Artificial intelligence functionality within Apple Intelligence is being developed gradually, with an emphasis on local data processing and partial cloud infrastructure. This reduces direct dependence on external models and limits the scale of their monetization effect within the iOS and macOS ecosystem. The parties have not ruled out an out-of-court settlement, but negotiations on revising the terms of the agreement are also making little progress.
The financial report for the first quarter was published on April 30, showing revenue declining from 143.8 billion dollars to 111.2 billion dollars, compared with 95.36 billion dollars a year earlier. Earnings per share also decreased from 2.84 dollars to 2.01 dollars, compared with 1.65 dollars previously. Dividend payment has not yet been announced, while the latest payment took place last week, when investors received 0.27 dollars per share for the first time. The average yield currently stands at around 0.37%, slightly below the sector average of 0.47%.
Support and resistance levels
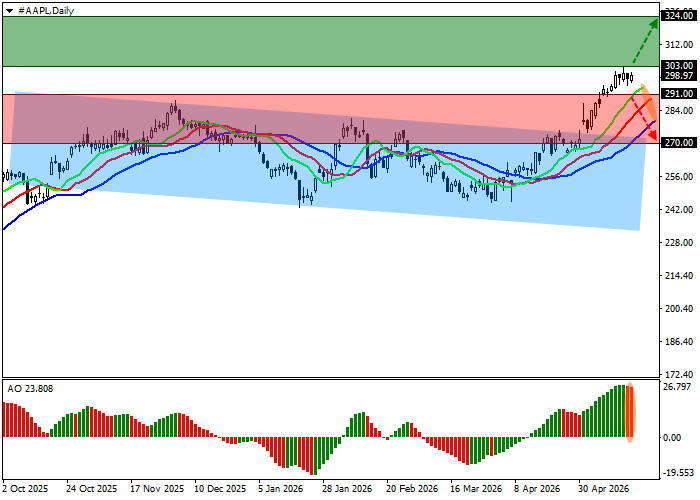
On the daily chart, the trading instrument is located above the resistance line of the descending channel with dynamic boundaries of 275.00–230.00.
Technical indicators are strengthening the buy signal: the EMA fluctuation range on the Alligator indicator is expanding upward, while the AO histogram is forming rising bars in the positive zone.
Resistance levels: 303.00, 324.00.
Support levels: 291.00, 270.00.
Trading scenarios and Apple Inc. forecast
Long positions can be opened after the price rises and consolidates above 303.00, with a target at 324.00. Stop-loss — 290.00. Expected timeframe: 7 days or more. Short positions can be opened after the price declines and consolidates below 291.00, with a target at 270.00 and a stop-loss at 300.00.
Scenario
| Timeframe | Weekly |
| Recommendation | BUY STOP |
| Entry point | 303.05 |
| Take Profit | 324.00 |
| Stop Loss | 290.00 |
| Key levels | 270.00, 291.00, 303.00, 324.00 |
Alternative scenario
| Recommendation | SELL STOP |
| Entry point | 290.95 |
| Take Profit | 270.00 |
| Stop Loss | 300.00 |
| Key levels | 270.00, 291.00, 303.00, 324.00 |
