

In particular, at 11:00 (GMT+2), market participants will focus on February eurozone data on retail sales and producer price indices, which do not yet reflect the changes caused by the large-scale conflict in the Middle East. Current forecasts suggest that annual retail sales growth slowed from 2.0% to 1.6%, while the monthly figure is expected at 0.2% after a previous decline of 0.1%. Producer inflation is also likely to continue its downward trend from 3.0% and 0.7% after -2.1% and 0.7%, respectively.
At 20:00 (GMT+2), US investors and forex traders will analyze the minutes of the Federal Reserve’s March monetary policy meeting, which may once again highlight the regulator’s hawkish stance on monetary conditions. For now, however, traders are digesting the February US durable goods orders data released yesterday. Recall that orders for capital goods fell by 1.4% after -0.5% the previous month, while analysts had expected no change at all. The indicator excluding defense orders declined by 1.2%, while excluding transportation it, on the contrary, rose by 0.8%, accelerating from January’s 0.3%. One of the main sources of pressure on the dollar came from the IBD/TIPP economic optimism data: the April reading fell sharply from 47.5 points to 42.8, whereas markets had expected 48.1.
Tuesday’s European data also came in weak: the services PMI fell from 51.9 points to 50.2 points, although it was slightly better than the preliminary estimate of 50.1 points, while the composite PMI dropped from 51.9 points to 50.7 points compared with 50.5 points, respectively. At the same time, the corresponding data for Germany showed a decline from 53.5 points to 50.9 points against a forecast of 51.2 points, while the composite indicator fell from 53.2 points to 51.9 points. Representatives of national businesses confirmed weaker domestic demand as well as a decline in new orders, while demand for services from foreign clients proved to be the lowest in six months. In turn, the April Sentix index, which reflects investor confidence in the bloc’s economic outlook, sharply accelerated its negative dynamics from -3.1 points to -19.2 points, marking the worst result in the last twelve months.
At the same time, the European Commission is urging member states to be cautious with large-scale spending aimed at compensating for rising energy prices, warning that the shocks caused by the escalation of the US-Iran conflict could turn into a new budget crisis. Recall that the governments of Germany, Italy, Spain, Portugal, and Austria are currently discussing the introduction of a windfall tax on energy companies to support households. Brussels emphasized that such steps should be temporary so as not to worsen the economic situation amid peak government debt, while containment measures such as subsidies or excise duty cuts should be targeted and short term, since excessive stimulus could lead to larger budget deficits. According to Eurostat, by the end of 2025 the EU’s total public debt exceeded 82.0% of gross domestic product (GDP), averaging 82.1-82.8%, which in absolute terms amounts to around 15.3 trillion euros, the highest level in the past two and a half years.
Despite the macroeconomic backdrop, investors are gradually pricing in a more aggressive monetary tightening by the European Central Bank (ECB). On Tuesday, Governing Council member and Governor of the National Bank of Belgium Pierre Wunsch said that the regulator may have to deliver several key interest rate hikes in the event of a prolonged energy crisis, not ruling out such a move as early as April, while derivatives markets are now pricing in as many as three adjustments before the end of the year. At the same time, his colleague from the Bulgarian National Bank, Dimitar Radev, called for a cautious approach, noting that it is still premature to discuss the need for changes at this month’s meeting, although he acknowledged that the adverse inflation scenario is becoming increasingly relevant.
Support and resistance levels
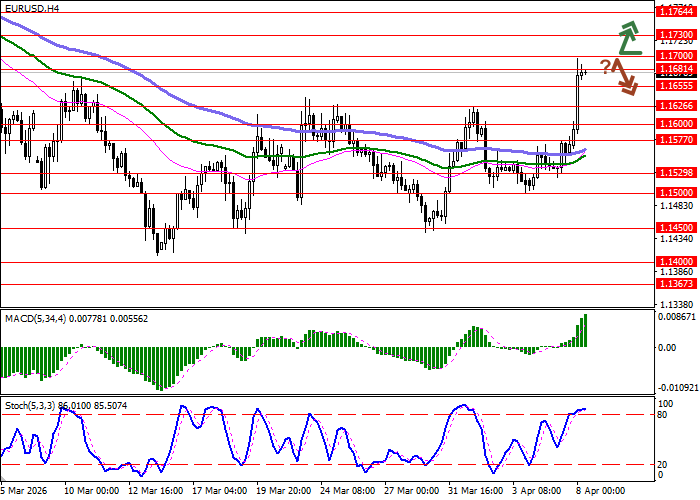
On the daily chart, Bollinger Bands are reversing into an upward plane: the price range is expanding, although for now it is not fully keeping pace with the surge in bullish sentiment. MACD is rising, maintaining a firm buy signal and attempting to consolidate above the zero line. Stochastic is showing confident growth, but is rapidly approaching the 80 mark, which signals the risk of overbought conditions for the euro in the ultra-short term.
Resistance levels: 1.1681, 1.1700, 1.1730, 1.1764.
Support levels: 1.1655, 1.1626, 1.1600, 1.1577.
Trading scenarios and EUR/USD forecast
Long positions may be opened after a confident breakout above the 1.1700 level, with a target at 1.1764. Stop-loss - 1.1655. Expected implementation period: 1-2 days.
A reversal downward near current price levels followed by a breakout below 1.1655 may become a signal to open short positions with a target at 1.1577. Stop-loss - 1.1700.
Scenario
| Timeframe | Intraday |
| Recommendation | BUY STOP |
| Entry Point | 1.1700 |
| Take Profit | 1.1764 |
| Stop Loss | 1.1655 |
| Key Levels | 1.1577, 1.1600, 1.1626, 1.1655, 1.1681, 1.1700, 1.1730, 1.1764 |
Alternative Scenario
| Recommendation | SELL STOP |
| Entry Point | 1.1650 |
| Take Profit | 1.1577 |
| Stop Loss | 1.1700 |
| Key Levels | 1.1577, 1.1600, 1.1626, 1.1655, 1.1681, 1.1700, 1.1730, 1.1764 |
