

In his Jackson Hole address, Warsh said the Federal Reserve would need to respond if inflation failed to return sustainably towards its 2.0% target. He also described monetary conditions as insufficiently restrictive and the labour market as being close to full employment. Markets interpreted the remarks as hawkish, pricing roughly a two-thirds probability of a 25-basis-point rate increase in September and close to a 90% chance of at least one increase by December. The initial Dollar reaction was also covered in our August 28 market review.
The US currency has since given back part of those gains as traders avoid large positions before Friday’s US employment report, due at 14:30 GMT+2. Economists expect the economy to have added approximately 58.0 thousand jobs in August, while unemployment is forecast to remain at 4.1%. A stronger report would reinforce expectations of tighter Federal Reserve policy. Meanwhile, the 10-year Treasury yield is approaching 4.78%, its highest level since early 2025, providing an underlying source of support for the Dollar despite its current consolidation.
Sterling is supported by relatively resilient UK data. Nationwide reported that house prices increased by 0.2% month-on-month and 1.6% year-on-year in August, while the British Retail Consortium said shop-price inflation accelerated to 1.5%, its highest rate since 2024. The final manufacturing PMI slipped only marginally from 51.9 to 51.7 and remained above the 50.0 threshold separating expansion from contraction. These figures keep the Bank of England’s policy debate alive, although most economists still expect borrowing costs to remain unchanged through the end of the year. The latest figures extend the relatively firm UK backdrop discussed in our previous GBP/USD forecast.
Support and Resistance Levels
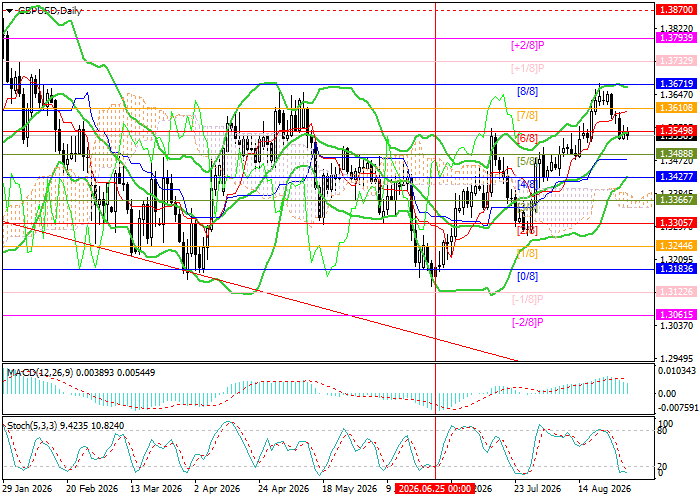
GBP/USD remains within the broad 1.3183–1.3671 range, corresponding to the Murrey [0/8]–[8/8] levels. After testing the upper boundary last week, the pair retreated towards the middle Bollinger Band at 1.3549, near Murrey [6/8]. A confirmed break below 1.3488, the Murrey [5/8] level, could open the way towards 1.3305, 1.3183 and 1.3061. Conversely, consolidation above 1.3671 would support an advance towards 1.3793 and the yearly high area near 1.3870.
Technical indicators remain mixed. The Bollinger Bands are directed higher, but the MACD histogram is losing momentum in positive territory. The Stochastic Oscillator has entered the oversold zone and may turn upwards shortly.
Support levels: 1.3488, 1.3305, 1.3183, 1.3061.
Resistance levels: 1.3671, 1.3793, 1.3870.
GBP/USD Trading Scenarios and Price Forecast
Long positions may be opened above 1.3671, with targets at 1.3793 and 1.3870 and a stop-loss at 1.3580. Time frame: 5–7 days.
Short positions may be opened below 1.3488, with targets at 1.3305, 1.3183 and 1.3061 and a stop-loss at 1.3580.
Scenario
| Timeframe | Weekly |
| Recommendation | BUY STOP |
| Entry Point | 1.3671 |
| Take Profit | 1.3793, 1.3870 |
| Stop Loss | 1.3580 |
| Key Levels | 1.3061, 1.3183, 1.3305, 1.3488, 1.3671, 1.3793, 1.3870 |
Alternative Scenario
| Recommendation | SELL STOP |
| Entry Point | 1.3488 |
| Take Profit | 1.3305, 1.3183, 1.3061 |
| Stop Loss | 1.3580 |
| Key Levels | 1.3061, 1.3183, 1.3305, 1.3488, 1.3671, 1.3793, 1.3870 |
