

Speaking at the Jackson Hole economic symposium on Friday, the official said that the regulator would need to take action if inflation does not move toward a sustainable return to the 2.0% target. According to Warsh, with the labor market remaining stable, consumer prices staying elevated and no clear signs that current monetary policy is sufficiently restraining inflation, the Fed should maintain its focus on price stability. Analysts viewed the comments as a direct signal that tighter monetary policy could return in the near future. According to the CME FedWatch Tool, traders currently estimate a 59.9% probability of a rate increase at the September meeting and an 88.0% probability of higher rates by December.
The pair has since corrected lower, supported by stronger-than-expected U.S. economic data for July. Industrial production increased by 0.1% instead of the expected 0.7% decline, while retail sales rose 4.0% compared with forecasts of 3.2%. Nevertheless, the current decline appears unstable and could soon be replaced by another upward move due to geopolitical factors. Over the weekend, the United States and Iran exchanged missile strikes, reducing market expectations for further de-escalation after Washington shifted toward economic pressure on Tehran through secondary sanctions against countries and organizations cooperating with Iran. Markets are closely monitoring developments, with renewed large-scale military escalation still possible. Such a scenario could push oil prices higher, increase inflationary pressure and raise the likelihood of higher borrowing costs, supporting the U.S. dollar.
Overall, fundamental factors continue to support the medium-term bullish outlook for USD/JPY.
Support and resistance levels
The trading instrument is testing the 160.15 level (Murray level [5/8], upper Bollinger Band). A breakout and consolidation above this level could open the way toward 161.72 (Murray level [7/8]), 162.50 (Murray level [8/8]) and 164.06 (Murray level [+2/8]). However, a break below 157.81 (Murray level [2/8]) could trigger a decline toward 156.25 (Murray level [0/8]) and 154.68 (Murray level [–2/8]).
Technical indicators provide mixed signals: Bollinger Bands are turning upward, the MACD histogram is declining in negative territory, while the Stochastic oscillator has entered the overbought zone and may reverse lower.
Support levels: 157.81, 156.25, 154.68.
Resistance levels: 160.15, 161.72, 162.50, 164.06.
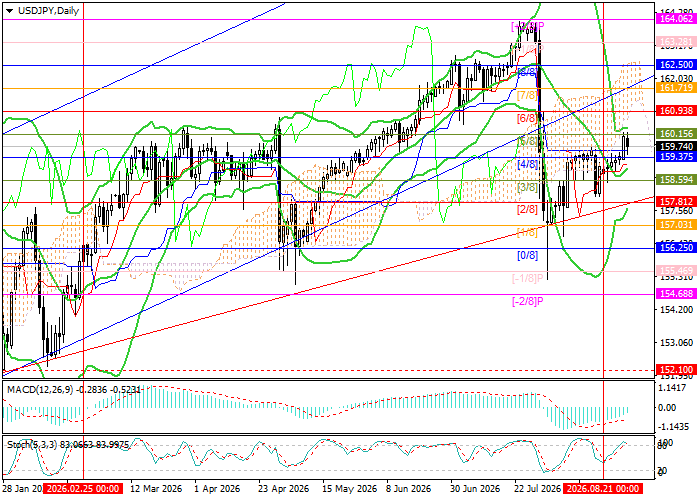
USD/JPY Trading Scenarios and Price Forecast
Long positions can be opened above 160.15 with targets at 161.72, 162.50 and 164.06 and a stop-loss at 159.00. Implementation period: 5–7 days.
Short positions can be opened below 157.81 with targets at 156.25 and 154.68 and a stop-loss at 158.80.
Scenario
| Timeframe | Weekly |
| Recommendation | BUY STOP |
| Entry Point | 160.15 |
| Take Profit | 161.72, 162.50, 164.06 |
| Stop Loss | 159.00 |
| Key Levels | 154.68, 156.25, 157.81, 160.15, 161.72, 162.50, 164.06 |
Alternative Scenario
| Recommendation | SELL STOP |
| Entry Point | 157.81 |
| Take Profit | 156.25, 154.68 |
| Stop Loss | 158.80 |
| Key Levels | 154.68, 156.25, 157.81, 160.15, 161.72, 162.50, 164.06 |
