

Geopolitical risk continues to underpin the metal. Commercial traffic through the Strait of Hormuz remains severely restricted, while discussions between Iran and Oman over a managed shipping route have yet to restore normal passage. The situation deteriorated again on Sunday after US forces struck Iranian rocket launchers on Larak Island and Tehran responded with attacks against American targets in the region.
The latest exchange shows why shipping companies remain reluctant to return to the waterway despite diplomatic efforts. As discussed in our previous XAU/USD forecast, prolonged disruption in the Persian Gulf threatens energy supplies and inflation, preserving part of gold’s defensive appeal.
The main counterweight is US monetary policy. In his Jackson Hole remarks, Federal Reserve Chair Kevin Warsh said policymakers must be confident that underlying inflation is returning to the 2.0% target clearly and quickly enough. However, he stopped short of committing to a rate increase, saying he was committed to discipline rather than a particular decision.
Markets nevertheless interpreted the speech as hawkish. The official Treasury yield curve shows that the 10-year rate rose from 4.64% on August 25 to 4.73% on Friday and 4.75% on Monday. Higher yields increase the opportunity cost of holding non-interest-bearing gold and have prevented geopolitical demand from producing a clean breakout.
Trading activity also increased during Friday’s sell-off. According to CME Group data, volume reached approximately 328.7 thousand gold futures contracts and 151.2 thousand options contracts. Futures recorded their highest August reading, while options approached the summer peak of 157.0 thousand contracts.
Support and Resistance Levels
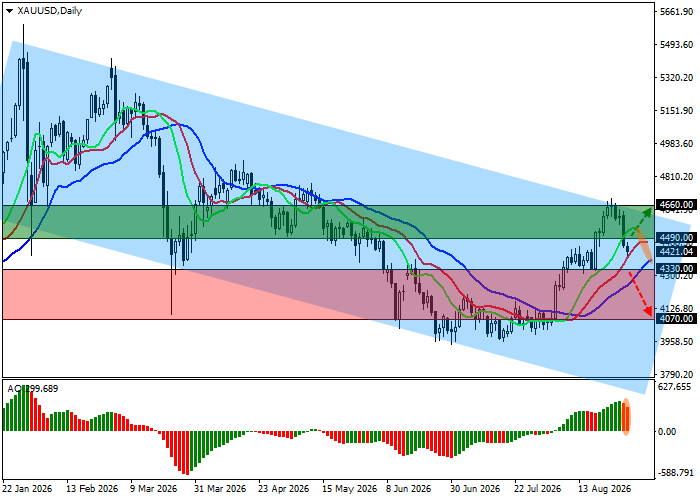
On the daily chart, XAU/USD remains below the resistance line of a descending channel with dynamic boundaries near 4700.0 and 3700.0.
The broader technical bias remains bullish, although momentum has softened. The fast EMAs of the Alligator indicator are holding above the slow line, while the Awesome Oscillator histogram is forming corrective bars in positive territory.
Support levels: 4330.0, 4070.0.
Resistance levels: 4490.0, 4660.0.
XAU/USD Trading Scenarios and Price Forecast
Long positions may be considered after a rise and consolidation above 4490.0, with a target at 4660.0 and a stop-loss at 4400.0. Time horizon: seven days or longer.
Short positions may be considered after a decline and consolidation below 4330.0, with a target at 4070.0 and a stop-loss at 4410.0.
Scenario
| Timeframe | Weekly |
| Recommendation | BUY STOP |
| Entry Point | 4490.0 |
| Take Profit | 4660.0 |
| Stop Loss | 4400.0 |
| Key Levels | 4070.0, 4330.0, 4490.0, 4660.0 |
Alternative Scenario
| Recommendation | SELL STOP |
| Entry Point | 4330.0 |
| Take Profit | 4070.0 |
| Stop Loss | 4410.0 |
| Key Levels | 4070.0, 4330.0, 4490.0, 4660.0 |
Conclusion: The bullish scenario requires a confirmed break above 4490.0 to open the way toward 4660.0. A loss of 4330.0 would weaken the current structure and shift attention to the deeper support at 4070.0.
