
The US Personal Consumption Expenditures Price Index held at 3.7% year-on-year in July, above the 3.6% forecast. Core PCE remained at 3.3%, leaving both measures well above the Federal Reserve’s 2.0% target.
The latest labor data also pointed to a resilient economy. Initial jobless claims fell to 203,000 from 207,000, beating the 208,000 forecast, while continuing claims declined from 1.796 million to 1.778 million. Markets now price an approximately 53% probability of at least one 25-basis-point rate increase by October and about 74% by December.
Attention now turns to Fed Chair Kevin Warsh’s Jackson Hole address later on Friday. A hawkish message could extend the Dollar’s recovery and push EUR/USD closer to support. The pair’s initial reaction to the inflation figures was examined in the previous EUR/USD forecast.
The Euro retains some support from the ECB outlook. Euro-area inflation rose to 2.9% in July, while the core rate reached 2.5%. Lending activity also strengthened: annual growth in adjusted loans to companies accelerated from 4.0% to 4.4%, while household lending increased from 3.0% to 3.1%. Combined with energy-related inflation risks, these figures keep the possibility of further ECB tightening alive.
Support and Resistance Levels
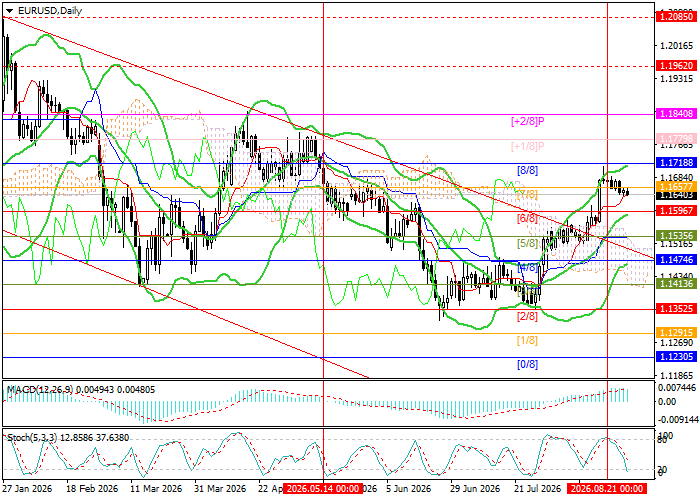
EUR/USD has broken above the descending channel but has yet to clear 1.1718, the Murrey [8/8] level. Consolidation above this resistance could open the way towards 1.1840 and 1.1962. A break below the middle Bollinger Band at 1.1535 would return the pair to the former channel and expose 1.1352 and 1.1230.
Technical indicators retain a moderate buy signal. The Bollinger Bands continue to slope higher, and the MACD histogram remains positive. Stochastic has entered oversold territory, suggesting that the correction may soon lose momentum.
Support levels: 1.1535, 1.1352, 1.1230.
Resistance levels: 1.1718, 1.1840, 1.1962.
EUR/USD Trading Scenarios and Price Forecast
Long positions may be opened above 1.1718, with targets at 1.1840 and 1.1962 and a stop-loss at 1.1630. Time frame: 5–7 days. Short positions may be opened below 1.1535, with targets at 1.1352 and 1.1230 and a stop-loss at 1.1640.
Scenario
| Timeframe | Weekly |
| Recommendation | BUY STOP |
| Entry Point | 1.1718 |
| Take Profit | 1.1840, 1.1962 |
| Stop Loss | 1.1630 |
| Key Levels | 1.1230, 1.1352, 1.1535, 1.1718, 1.1840, 1.1962 |
Alternative Scenario
| Recommendation | SELL STOP |
| Entry Point | 1.1535 |
| Take Profit | 1.1352, 1.1230 |
| Stop Loss | 1.1640 |
| Key Levels | 1.1230, 1.1352, 1.1535, 1.1718, 1.1840, 1.1962 |
