

The index remains below its recent highs, extending the correction discussed in our previous Nikkei 225 outlook. This week, attention is shifting towards domestic economic releases, the September Bank of Japan meeting and the possibility of another currency intervention if the yen resumes a sustained decline beyond 160.00 per US Dollar.
US Treasury Secretary Scott Bessent met Japanese Finance Minister Satsuki Katayama and Bank of Japan Governor Kazuo Ueda during the G20 finance gathering in Asheville, North Carolina. Japan and the United States agreed to maintain coordination aimed at securing orderly currency moves after last month’s joint intervention failed to establish lasting support for the yen. Bessent described the latest decline as relatively contained, while Katayama reiterated that the authorities remained prepared to respond to disorderly market conditions. The currency backdrop is also examined in the latest USD/JPY forecast.
Pressure from Japan’s bond market has intensified. The benchmark 10-year government bond yield reached 3.00% for the first time since 1996, while the 20-year and 30-year yields rose towards 3.88% and 4.18%, respectively. The sell-off reflects higher inflation expectations and growing confidence that the Bank of Japan will raise its policy rate again at the September 17–18 meeting. Higher yields increase financing costs and make expensive growth stocks less attractive, leaving the Nikkei vulnerable to further volatility.
During the morning session, Tokai Carbon Co. Ltd. (+7.49%), Kansai Electric Power Co. Inc. (+7.12%), JTEKT Corp. (+5.11%), Sumitomo Pharma Co. Ltd. (+4.41%) and Suzuki Motor Corp. (+3.09%) were among the strongest performers.
Mitsubishi Materials Corp. (–7.16%), Japan Steel Works Ltd. (–5.04%), Advantest Corp. (–4.54%), DOWA Holdings Co. Ltd. (–3.88%) and Mitsubishi Heavy Industries Ltd. (–3.63%) recorded the largest declines. These figures represent an intraday snapshot and may change before the close.
Support and Resistance Levels
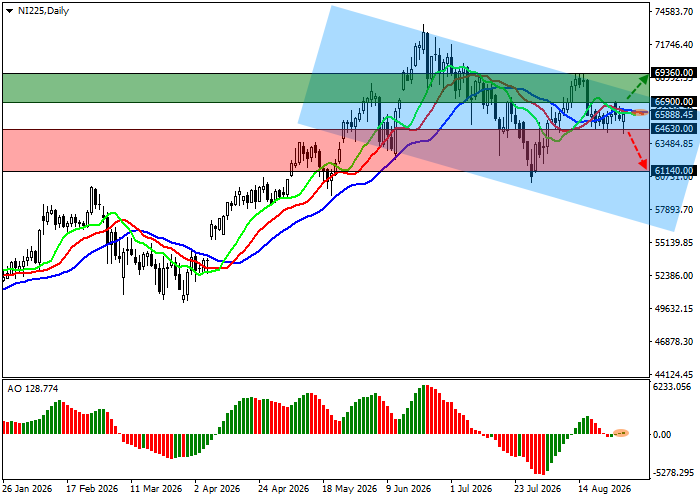
On the daily chart, the index is approaching the upper boundary of a descending channel with dynamic limits near 67000.0 and 55500.0.
Technical indicators retain a buy signal, although momentum remains uneven. The fast moving averages of the Alligator indicator are holding above the slow line and gradually widening, while the Awesome Oscillator remains in positive territory but is forming corrective bars.
Support levels: 64630.0, 61140.0.
Resistance levels: 66900.0, 69360.0.
Nikkei 225 Trading Scenarios and Price Forecast
Long positions may be considered after the index rises and consolidates above 66900.0, with a target at 69360.0 and a stop-loss at 66000.0. Time horizon: seven days or more.
Short positions may be considered after a decline and consolidation below 64630.0, with a target at 61140.0 and a stop-loss at 65500.0.
Scenario
| Timeframe | Weekly |
| Recommendation | BUY STOP |
| Entry Point | 66900.0 |
| Take Profit | 69360.0 |
| Stop Loss | 66000.0 |
| Key Levels | 61140.0, 64630.0, 66900.0, 69360.0 |
Alternative Scenario
| Recommendation | SELL STOP |
| Entry Point | 64630.0 |
| Take Profit | 61140.0 |
| Stop Loss | 65500.0 |
| Key Levels | 61140.0, 64630.0, 66900.0, 69360.0 |
