
At present, the US dollar is being supported by the growing likelihood of monetary policy tightening by the US Federal Reserve. Last week, officials kept the interest rate in the 3.50%–3.75% range; however, their rhetoric became more hawkish, and nine out of nineteen members of the Federal Open Market Committee (FOMC) suggested that borrowing costs could be raised this year amid persistent inflationary pressure caused by the energy crisis and trade tariffs. The regulator’s intentions have sparked dissatisfaction at the White House: Treasury Secretary Scott Bessent called for abandoning forecasts based on “dot plot models,” arguing that they are often inaccurate. Nevertheless, current conditions in the US economy allow for higher borrowing costs: the Consumer Price Index remains well above the regulator’s 2.0% target, reaching 4.2% in May; the labour market remains stable; and the economy continues to recover, with the June manufacturing activity index accelerating to 55.7 points and the services index rising to 51.3 points. Most traders now expect an interest rate adjustment as early as September, while some forecasts suggest that the rate could increase by 75 basis points by the end of the year.
The Bank of Japan maintains a similar stance. At its latest meeting, officials raised borrowing costs to 1.00%, and some policymakers are calling for a faster adjustment of credit conditions, as Japanese companies are actively passing higher costs on to consumers. However, price pressure in the country has recently shown signs of slowing: in May, the Consumer Price Index stood at 1.5% year-on-year, while the core indicator was 1.4%, both significantly below the 2.0% target. Tomorrow at 01:30 (GMT+2), June inflation data for the Tokyo metropolitan area will be released. The core indicator is expected to accelerate from 1.3% to 1.6% year-on-year; however, if a slowdown is recorded, the continuation of hawkish policy in the near term could be called into question.
Overall, fundamental factors favour further strengthening of USD/JPY.
Support and resistance levels
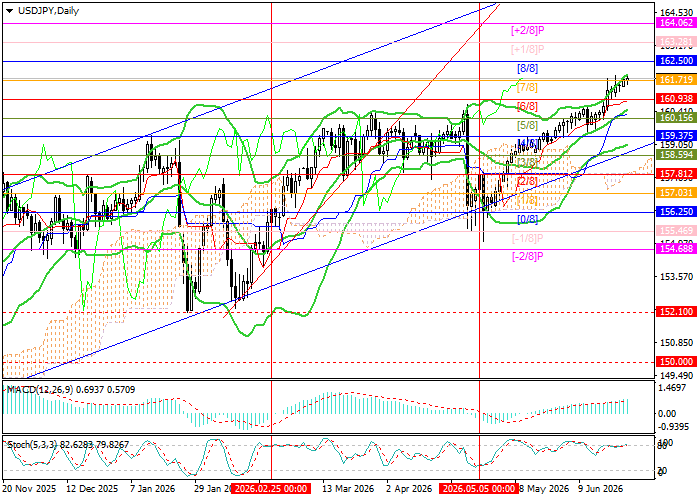
The trading instrument is moving within a long-term ascending channel. The price is attempting to consolidate above 161.71 (Murray level [7/8]), after which further growth toward 163.28 (Murray level [+1/8]) and 164.06 (Murray level [+2/8]) is expected. However, if the price breaks below 159.37 (Murray level [4/8]) and the middle line of the Bollinger Bands, it will leave the ascending channel and decline toward 157.03 (Murray level [1/8]) and 156.25 (Murray level [0/8]).
Technical indicators maintain a buy signal: the Bollinger Bands are directed upward, the MACD histogram is expanding in positive territory, and the Stochastic is moving sideways near the overbought zone, which does not rule out a limited correction.
Resistance levels: 161.71, 163.28, 164.06.
Support levels: 159.37, 157.03, 156.25.
Trading scenarios and USD/JPY forecast
Long positions may be opened from 162.00, with targets at 163.28 and 164.06, and a stop-loss at 161.10. Expected implementation period: 5–7 days.
Short positions may be opened below 159.37, with targets at 157.03 and 156.25, and a stop-loss at 160.70.
Main scenario
| Timeframe | Weekly |
| Recommendation | BUY STOP |
| Entry point | 162.05 |
| Take Profit | 163.28, 164.06 |
| Stop Loss | 161.10 |
| Key levels | 156.25, 157.03, 159.37, 161.71, 163.28, 164.06 |
Alternative scenario
| Recommendation | SELL STOP |
| Entry point | 159.35 |
| Take Profit | 157.03, 156.25 |
| Stop Loss | 160.70 |
| Key levels | 156.25, 157.03, 159.37, 161.71, 163.28, 164.06 |
