

Today, a joint statement by representatives of Qatar and Pakistan, acting as mediators in negotiations between Washington and Tehran, was published, according to which the parties have defined a joint action plan for the next 60 days allocated for the final coordination of a peace deal. Progress in the negotiations was also confirmed by Iranian Foreign Minister Abbas Araghchi, who stated that the Islamic Republic had secured the lifting of restrictions on hydrocarbon exports, the removal of the port blockade, and the unfreezing of part of its frozen assets. However, he added that the ongoing conflict between Israel and the Lebanese militant organization Hezbollah casts doubt on the parties’ diplomatic efforts. Official Tehran stated that if Tel Aviv refuses to cease hostilities and withdraw troops from occupied territories, shipping through the Strait of Hormuz will be halted again and oil prices will resume their rise. It is worth noting that U.S. President Donald Trump reacted aggressively to these comments, stating that he would resume attacks in such a case, which caused extreme dissatisfaction from the other side.
For now, “black gold” quotes continue to decline, although rather slowly, as U.S. fuel reserves and the production capacity of Persian Gulf countries continue to shrink. Thus, the main Qatari liquefied natural gas (LNG) processing facility in Ras Laffan, with annual output of 77.0 million metric tons, was damaged in an explosion the day before. It should also be noted that, according to experts, even if the confrontation in the Middle East ends immediately, the recovery of energy supplies to the market will be very gradual, and in the third quarter of this year the increase may not exceed 2.0–3.5 million barrels per day.
Support and resistance levels
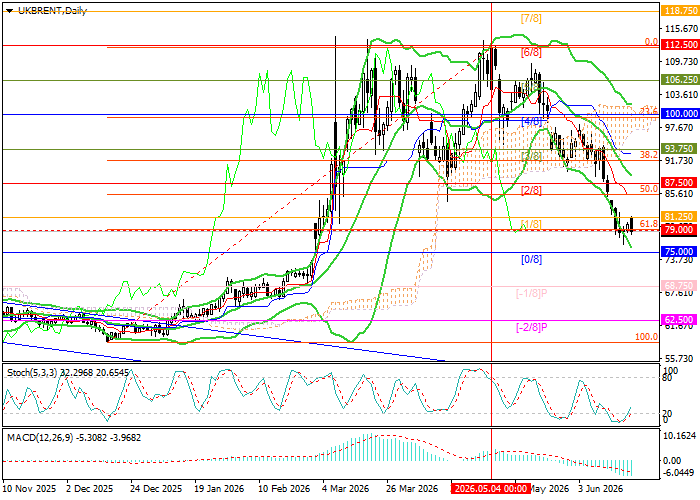
The trading instrument is moving within a medium-term downward trend: after the price consolidates below 79.00 (Fibonacci correction 61.8%), a decline toward 75.00 (Murray level [0/8]), 68.75 (Murray level [–1/8]), and 62.50 (Murray level [–2/8]) is likely. However, if the price breaks above the middle line of the Bollinger Bands at 87.50 (Murray level [2/8]), growth is expected to resume toward targets at 93.75 (Murray level [3/8]) and 100.00 (Murray level [4/8], Fibonacci correction 23.6%).
Technical indicators confirm the continuation of the downward trend: Bollinger Bands are directed downward, the MACD histogram is stable in the negative zone, and the Stochastic is leaving the oversold area, which does not rule out a limited correction.
Resistance levels: 87.50, 93.75, 100.00.
Support levels: 79.00, 75.00, 68.75, 62.50.
Brent Crude Oil trading scenarios and forecast
Short positions may be opened below 79.00 with targets at 75.00, 68.75, and 62.50, and a stop-loss at 82.00. Expected timeframe: 5–7 days. Long positions may be opened above 87.50 with targets at 93.75 and 100.00, and a stop-loss at 84.80.
Scenario
| Timeframe | Weekly |
| Recommendation | SELL |
| Entry point | 78.59 |
| Take Profit | 75.00, 68.75, 62.50 |
| Stop Loss | 82.00 |
| Key levels | 62.50, 68.75, 75.00, 79.00, 87.50, 93.75, 100.00 |
Alternative scenario
| Recommendation | BUY STOP |
| Entry point | 87.55 |
| Take Profit | 93.75, 100.00 |
| Stop Loss | 84.80 |
| Key levels | 62.50, 68.75, 75.00, 79.00, 87.50, 93.75, 100.00 |
